Temperature calibration – How to do it right
Procedures for calibration of transmitters with RTD or Thermocouple sensors
 12 August 2022
Temperature transmitters are in use across all industries. Given the name, it is clear that a temperature transmitter transmits the temperature value it gets from the primary temperature sensing element.
The industrial primary sensing elements are mostly RTDs (Resistance Temperature Detector) and thermocouples. The output from an RTD is in terms of resistance, while a thermocouple’s output signal is in millivolts.
The temperature transmitter receives the signal from an RTD or a thermocouple. The transmitter evaluates the signal and converts it into an output signal like 4 to 20 mA, Foundation Fieldbus, Profibus PA, or any other type of signal like wireless. Mostly 4 to 20 mA and Foundation Fieldbus output signals are used in industries.
A temperature transmitter consists of electronic circuits. Usually, the performance of electronic circuits deteriorates with time. When the performance of the temperature transmitter deteriorates with time, it may start producing inaccurate readings. The temperature readings we get may be unreliable.
In the field of instrumentation, this slow deterioration of accuracy is called ‘drift’. Due to drift, the output of the temperature transmitter becomes inaccurate. For this purpose, we need to calibrate the temperature transmitter at regular intervals or when its output seems incorrect.
Temperature sensors like RTDs or thermocouples are exposed to high and low temperatures as per the applications. Due to the effect of varying temperatures, the material of the sensor also degrades with time. This degradation affects the sensor’s response and accuracy.
Thus, the validation of the sensors is also essential for getting accurate temperature measurements.
How do we approach a temperature calibration?
We already discussed that temperature transmitters can accept input from an RTD or a thermocouple.
The outputs of temperature transmitters can also be in many forms like 4 to 20 mA or Foundation Fieldbus signal (many others exist but these two are the most widely used, so we will consider only these two).
With two different input sensors and two different output signals, there are four possible combinations of temperature transmitters:
- RTD with 4 – 20 mA HART transmitter
- Thermocouple with 4 – 20 mA HART transmitter
- RTD with Foundation Fieldbus transmitter
- Thermocouple with Foundation Fieldbus transmitter
Temperature transmitters can also be compact (with the transmitter in the head of the temperature probe) or remote (with the transmitter at a distance away from the probe).
Usually, temperature measurements with compact transmitters will be completely demounted and calibrated in the workshop. In contrast, for measurements with remote transmitters, the sensor will be calibrated in the workshop and the transmitter is calibrated in the plant.
We will split the calibration procedure into two parts:
- First, we will validate the RTD or thermocouple in the workshop.
- Second, we will calibrate the temperature transmitter in the plant.
RTDs or thermocouples are validated in the workshop because they are difficult to validate in the plant for various reasons. The most important reason is that they need to be checked at different calibration temperatures. Generating different process temperatures in a running plant is impossible to do, and taking a temperature bath calibrator to the plant is impractical as these probes are often installed at places difficult to reach.
You may have noticed that we use the term validation instead of calibration for the temperature sensor. Validation (also called tolerance testing) means that we’re just going to check that the accuracy of the RTD or thermocouple is still within that sensor’s original accuracy class. If the sensor fails the test, we gonna have to replace it with a new one.
Calibration of a temperature sensor (also called characterization) is possible but more complicated and is usually only done for very accurate measurements. The characterization method compares the sensor to a highly accurate standard reference sensor. Calibration factors will then be calculated using methods like Callendar-Van Dusen for RTDs. These factors are entered into the transmitter to compensate for the inaccuracy of the sensor.
What tools are required to perform a temperature calibration?
To perform an accurate calibration, you need the right tools. There are many types of calibration tools. The ones we will be using are listed below:
- Decade box
- Portable digital calibrator or Beamex or Scandura
- Digital multimeter
- Temperature bath
- HART communicator compatible with HART and Foundation Fieldbus devices
All the tools and tackles should be calibrated and the calibration date should not be due. Generally, a calibration sticker is attached to every tool for verification of its calibration status.
To perform highly accurate calibrations the temperature bath itself must be calibrated once a year.
The accuracy test or say calibration of these calibration tools is done by the National Test Laboratories. These laboratories have the most accurate instruments and are standard for the whole country.
For a perfect calibration, it is important that the accuracy of the calibration tools are at least 4 times to even 10 times more accurate than the device under test. If you want to calibrate a modern temperature transmitter, it is enough to use calibration equipment that is 4 times more accurate. That’s because present-day transmitters are already highly precise. Very old transmitters need to be calibrated with 10 times more accurate equipment.
Some points to be taken care of before starting a calibration
A few important points should be taken care of before proceeding with the job on the temperature transmitter:
- Check if the transmitter has an interlock in the PLC or DCS. If any interlock is present, bypass the interlock with a proper interlock bypass procedure.
- If any control valve is being controlled by the temperature value of the temperature transmitter, then ask the operation department to put the control valve in manual mode. Because during the calibration job, the temperature values will vary and if the control valve is in auto mode, the valve will make movements that will have an adverse effect on the process.
- The temperature values may be used by other plants for some reason. So inform the respective plants that the temperature transmitter is going under calibration process and values will vary.
- Some critical tags are configured in a text message or email system. Whenever there is a high or low value detected by the system on the particular tag, a message will be sent through text message or email. Inform all the configured contacts in the list about the calibration job on the temperature transmitter.
Validation procedure for an RTD sensor using a multimeter
To validate an RTD, we need to know some basic things.
- We need to know the type of RTD, i.e. Pt100 or Pt1000, or any other type.
- Check the datasheet or the transmitter’s configuration to find the temperature span of the transmitter.
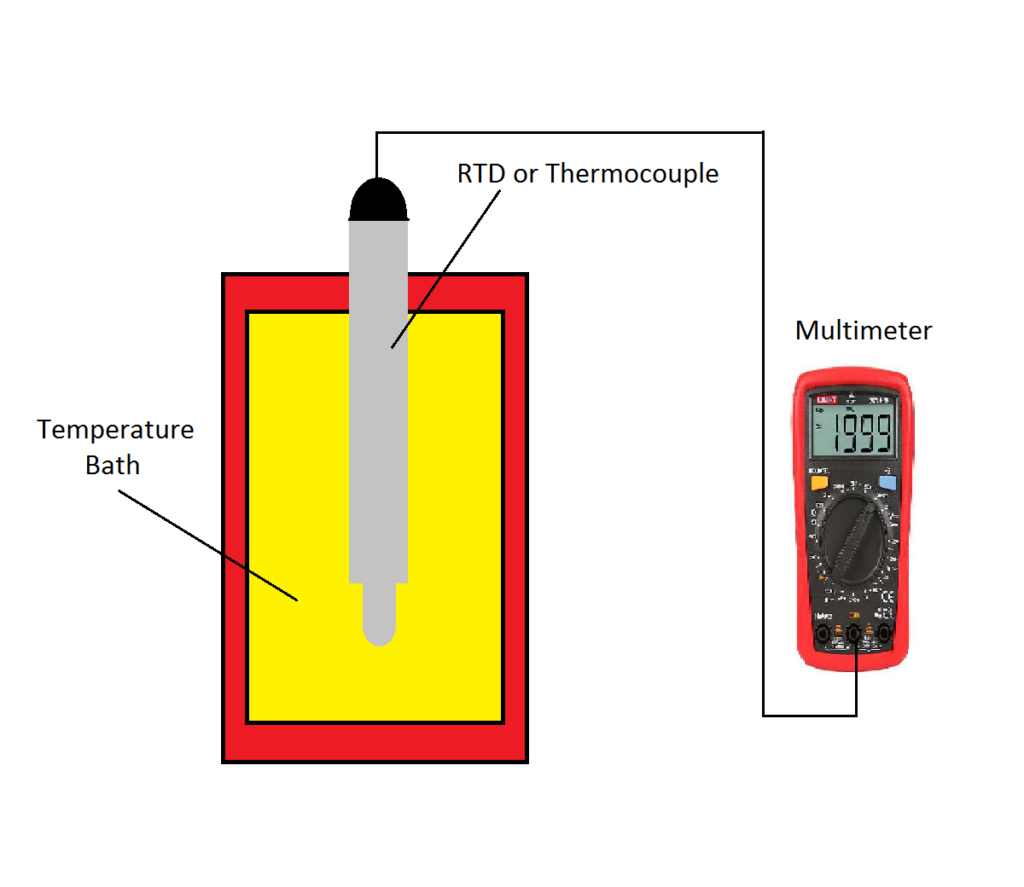
We will use a temperature bath and a multimeter in a setup like the one shown below.
Validation procedure:
- Put the RTD into the temperature bath. Insert it up to the insertion length given in the datasheet.
- Connect a multimeter to the RTD as per the configuration of the RTD, i.e. 2 wire, 3 wire, or 4 wire. And configure the multimeter to measure the resistance in Ohm.
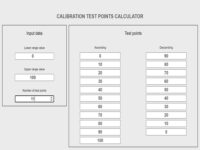
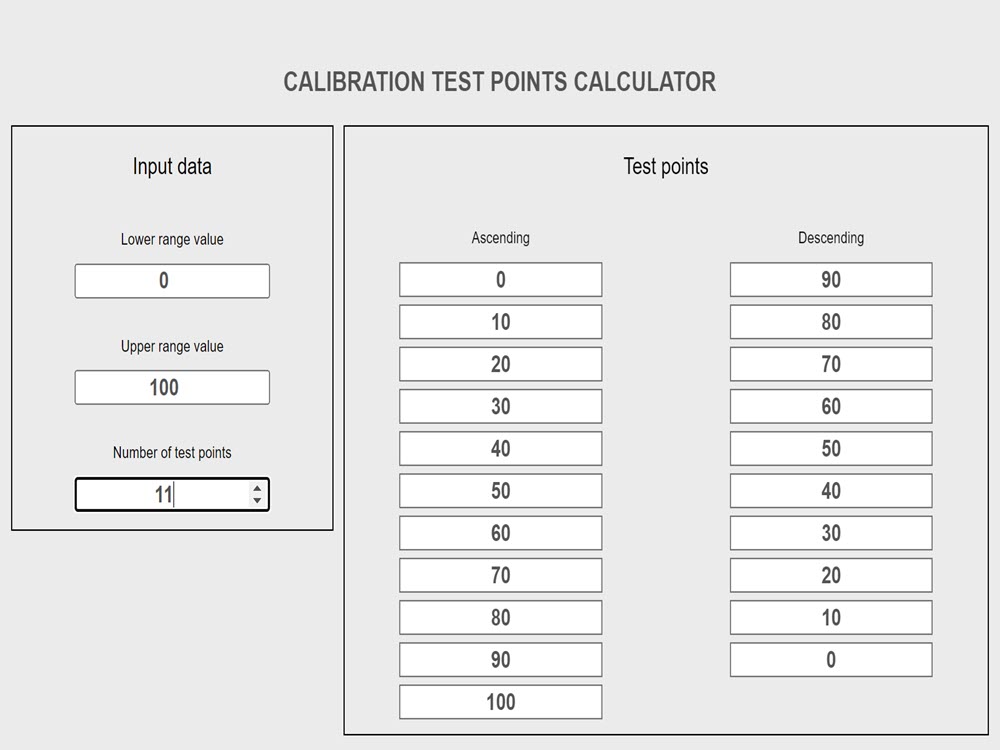
- Divide the span of the transmitter into 4 equal parts of 25% each. You now have 5 different test temperatures, i.e. 0%, 25%, 50%, 75%, and 100% of the span. If you don’t want to calculate these 5 test temperatures, you can use our automated calibration test points calculator.
- Set the temperature bath to the 0% test point and wait until the temperature stabilizes. The 0% temperature should correspond to the lower range value of the transmitter. Stabilizing may take several minutes. If readings remain unstable, then check the termination tightness. Due to loose connections, the resistance might vary.
- When the temperature bath indicates that the temperature is stable, note the Ohm reading from the multimeter in the ‘Output Ohm’ column on the table below.
- In the temperature vs resistance table for the particular RTD, look for the resistance value corresponding to the temperature indicated on the temperature bath. Note this resistance value in the ‘Desired Ohm’ column.
- Repeat points 3 to 5 for the steps 25%, 50%, 75%, and 100% in ascending order.
- Repeat points 3 to 5 for the steps 75%, 50%, 25%, and 0% in descending order.
- Calculate the error from the readings in percentage as follows:
[(Output Ohm – Desired Ohm) / Desired Ohm] * 100 - The RTD is still ok if the maximum error is less than the value of the error which is desired for the process conditions. This value can be fetched from the datasheet of the RTD.
- If the maximum error is more than the error value mentioned on the datasheet then the RTD should be immediately replaced.
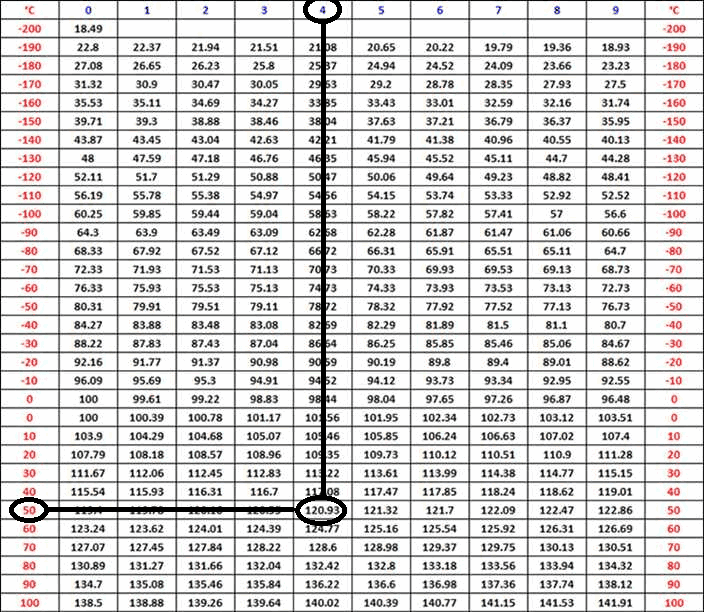
Use the table shown below for noting down the values. ‘Desired Ohm’ can be read from the particular RTD temperature vs resistance chart shown below this table. ‘Output Ohm’ is what you read from the multimeter. Error% is calculated with the formula from the above point 8.

To know the Ohm value of a particular type of RTD, you need the temperature vs resistance chart for that specific RTD. Here below you see an example of such a chart. Remember that a Pt100, a Pt1000, or any other RTD type has a different temperature vs resistance chart.
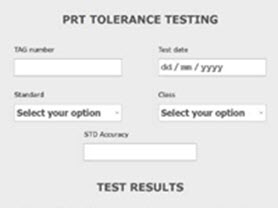
RTDs can also be checked by tolerance testing. Here’s an easy tool to do it:
Validation procedure for a thermocouple sensor
- Put the thermocouple into the temperature bath as we did for the RTD. Insert it up to the insertion length given in the datasheet.
- Connect a multimeter to the thermocouple and configure the multimeter to measure the voltage in millivolts.
- Set the temperature of the calibration bath to 0%, 25%, 50%, 75%, and 100% of the transmitter’s span. The 0% temperature should correspond to the lower range value of the transmitter. To calculate these 5 test temperatures, you can use our automated calibration test points calculator.
- When the temperature bath indicates that the temperature is stable, note the millivolts reading from the multimeter in the ‘Output mV’ column on the table below.
- In the temperature vs voltage table for the particular thermocouple, look for the millivolts value corresponding to the temperature indicated on the temperature bath. Note this millivolt value in the ‘Desired mV’ column.
- Repeat points 3 to 5 for the steps 25%, 50%, 75%, and 100% in ascending order.
- Repeat points 3 to 5 for the steps 75%, 50%, 25%, and 0% in descending order.
- Calculate the error from the readings in percentage as follows:
[(Output mV- Desired mV) / Desired mV] * 100 - The thermocouple is still ok if the maximum error is less than the value of the error which is desired for the process conditions. This value can be fetched from the datasheet of the thermocouple.
- If the maximum error is more than the error value mentioned on the datasheet then the thermocouple should be immediately replaced.
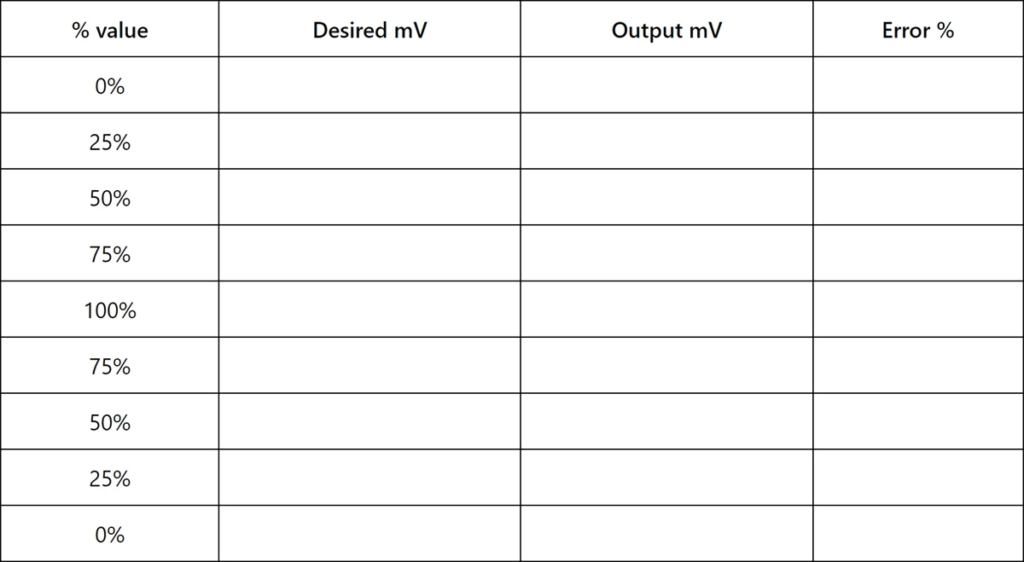
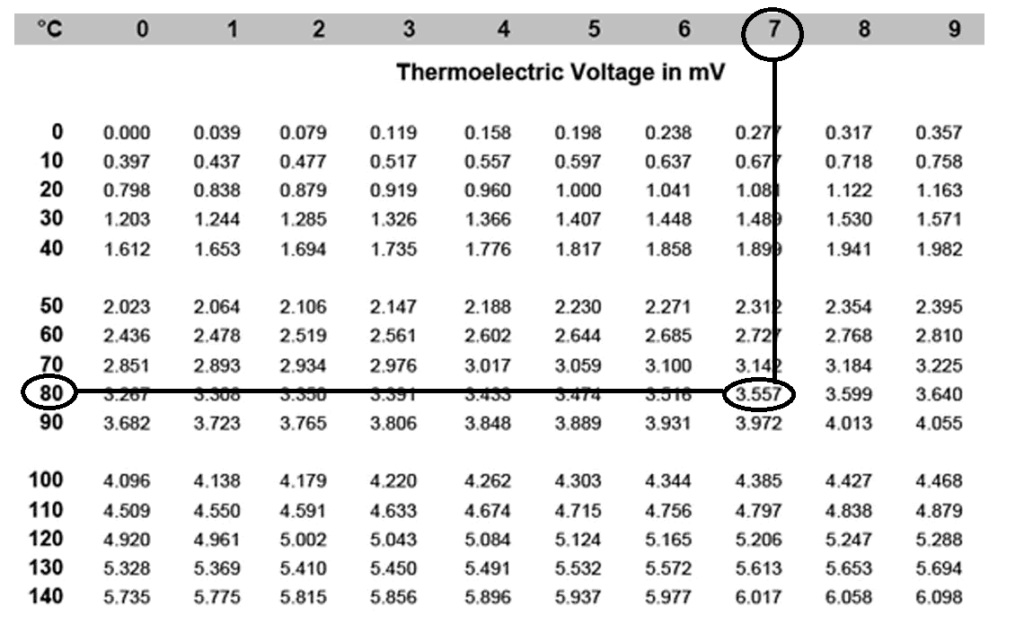
Use the table shown below for noting down the values. ‘Desired mV’ can be read from the particular thermocouple temperature vs voltage chart shown below this table. ‘Output mV’ is what you read from the multimeter. Error% is calculated with the formula from the above point 8.
To know the mV value of a particular type of thermocouple, you need the temperature vs voltage chart for that specific thermocouple. Here below you see an example of such a chart. Remember that a type J, K, B, or any other thermocouple type has a different temperature vs voltage chart.
Calibration procedure for a temperature transmitter
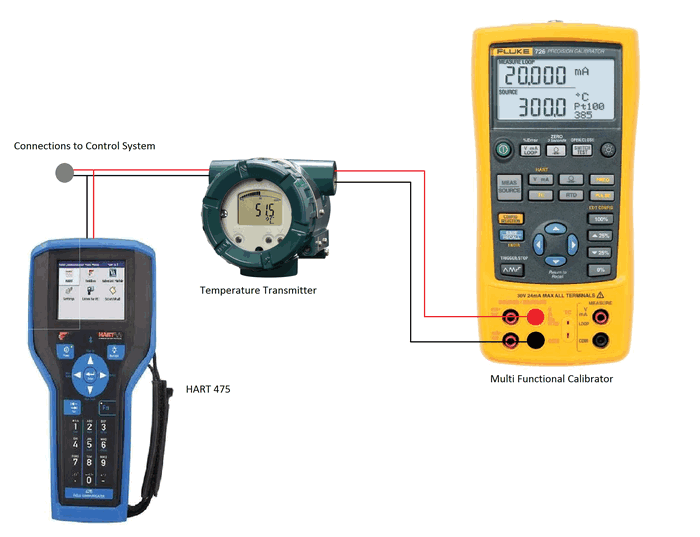
We will do the calibration in the field with the transmitter still connected to the PLC or DCS. So, before starting the below procedure, don’t forget to take the control loop in manual and disable eventual interlocks in the system. Also, check if a copy of the signal is sent to other parts of the plant or if the tag is used in systems sending out text messages or emails. Inform the operator and any other people concerned about the ongoing calibration job.
- Connect a multi-functional calibrator or any other device like a decade box, a Scandura, or a Beamex to the temperature transmitter.
- Configure the calibrator according to the type of temperature sensor that is or will be connected to the transmitter. The output of the calibrator should be in ohms if the temperature sensing element is an RTD, or in mV when de sensing element is a thermocouple.
- Apply the ohm or mV signals from the multi-functional calibrator to the temperature transmitter in steps of 25%, starting from 0% to 100%. To calculate these 5 test temperatures, you can use our automated calibration test points calculator.
The 0% value corresponds to the lower range value (LRV) of the transmitter’s configured range.
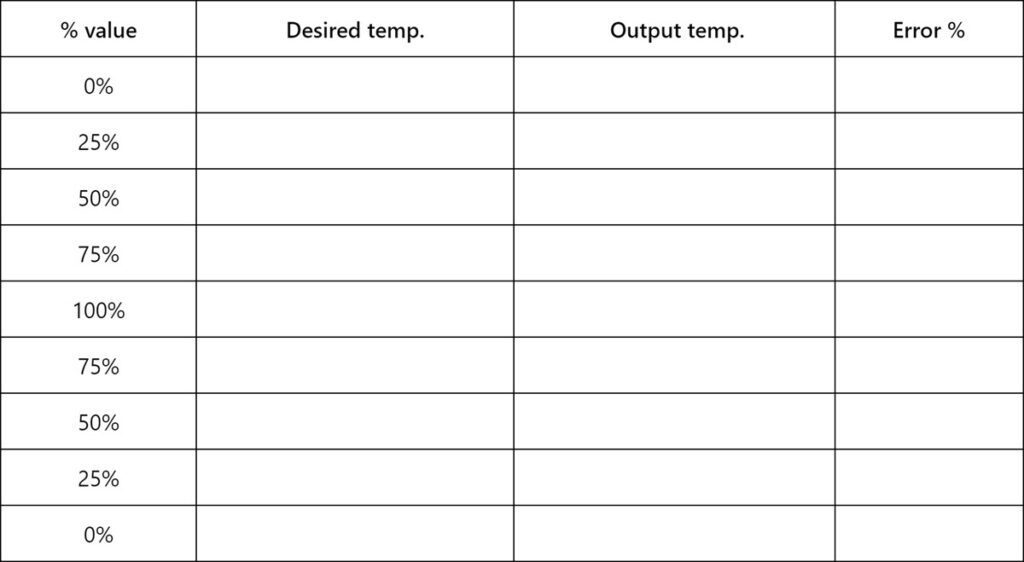
The 100% value corresponds to the upper range value (URV) of the transmitter’s configured range. - Note the applied temperature values from the calibrator (desired temp.) and the output signal from the temperature transmitter (output temp.) in the table below.
- Similarly apply values in the downward direction in steps of 25%. Also, note these values in the table below. Confirm the values with the values in the HMI or DCS.
- Calculate the error from the readings in percentage as follows:
[(Output temp. – Desired temp.) / (URV – LRV)] * 100 - The temperature transmitter is still ok if the maximum error is less than the value of the error which is desired for the process conditions. This value can be fetched from the datasheet of the transmitter.
- If the maximum error is more than the error value mentioned on the datasheet then the temperature transmitter has to be calibrated.
- To calibrate the temperature transmitter, first apply the 0% value from the calibrator. Do the zero trim of the transmitter using the HART communicator.
- Then apply the 100% value from the calibrator and do the span trim of the transmitter using the HART communicator.
- Now again check all the steps starting from step 3.
- Restore the interlocks which are bypassed and ask the operator to put the control valve back in auto mode after job completion.
- Inform all concerned persons about the completion of the activity.
What is the importance of calibrating temperature measurements?
Timely calibration of temperature measurements is essential in any industry. Knowing the exact temperature of the process improves process efficiency.
Suppose the temperature reading shows a lower temperature than the actual process temperature, then more energy is needed to maintain the temperature. This deviation can also damage the product due to overheating.
Inversely, if the temperature transmitter shows a higher temperature than the actual temperature, the product will get low heat, and the quality will not be up to the mark.
A calibrated temperature transmitter also helps to avoid unwanted trips due to disturbed plant parameters.
In some critical and hazardous process industries, inaccurate readings from the temperature transmitter can also put lives in danger.
Often, the performance of the temperature transmitter during plant run may not be accurate due to various reasons such as the environment. This environmental influence also changes the transmitter’s response over time and leads to deviations in the readings.
Performing the transmitter calibration will help eliminate the drift in readings and reduce the disastrous impact on productivity. Calibrating the instrument will also help to ensure that the processes will deliver desired results as per design.
Additionally, some machines should be protected against high temperatures, e.g. compressors, heaters… Additional heat or high temperatures will damage the machine or equipment.
Therefore, temperature transmitters should be calibrated at regular intervals.
Related topics
Leave a Comment
Your email address will not be published. Fields marked with * are required.