
DP Flow Transmitter Calibration: A Step-by-Step Guide
 14 June 2023
Differential pressure flow meters are widely used in the industry for the measurement of flow in a closed pipe.
This kind of flowmeter consists of two parts:
- The primary element
- The differential pressure transmitter
The DP flow meter will calculate the flow rate by measuring the differential pressure across a primary element.
Various types of primary elements can be used to obtain differential pressure. Some of the most common primary elements are orifice plates, (averaging) pitot tubes, venturi tubes, and flow nozzles.
They all operate on the same principle that the flow through the primary element is proportional to the differential pressure across the element.
Although DP type flow transmitters are known for their high performance and reliability, they will need a recalibration from time to time.
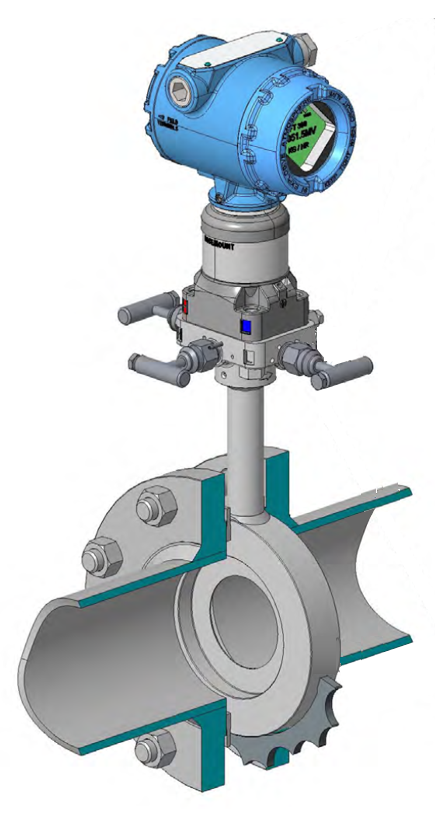
For the purpose of the calibration procedure that we will describe further on, we will consider a DP transmitter with an orifice plate as the primary element.
To be clear, we are not going to calibrate the entire flow measurement, but only the DP flow transmitter. To calibrate the complete flow measurement, the primary element and the DP flow transmitter would have to be demounted and then installed on a flow test bench to be compared with a reference flow meter. This is something that is typically done in a calibration lab.
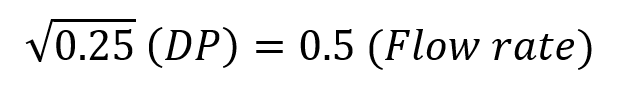
Relationship between Flow Rate and Differential Pressure
The following equation describes the relationship between flow rate and differential pressure:
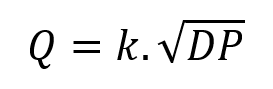
where Q is the volumetric flow rate, k is a constant, DP is the differential pressure, and the square root function represents the relationship between velocity and pressure.
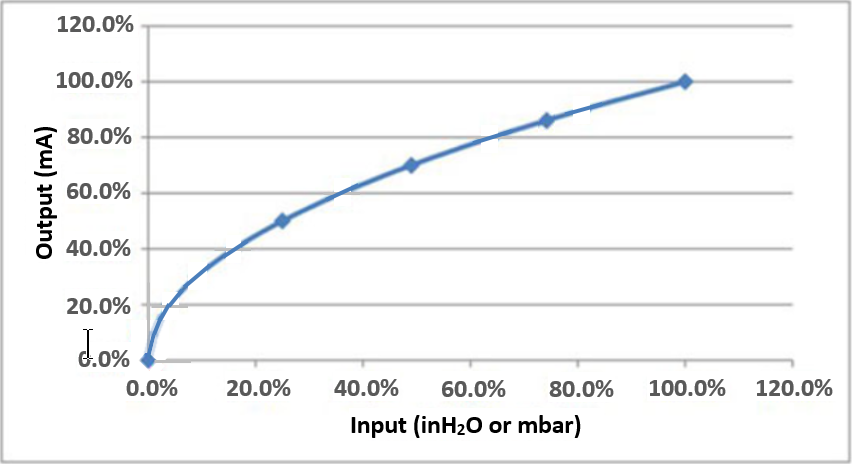
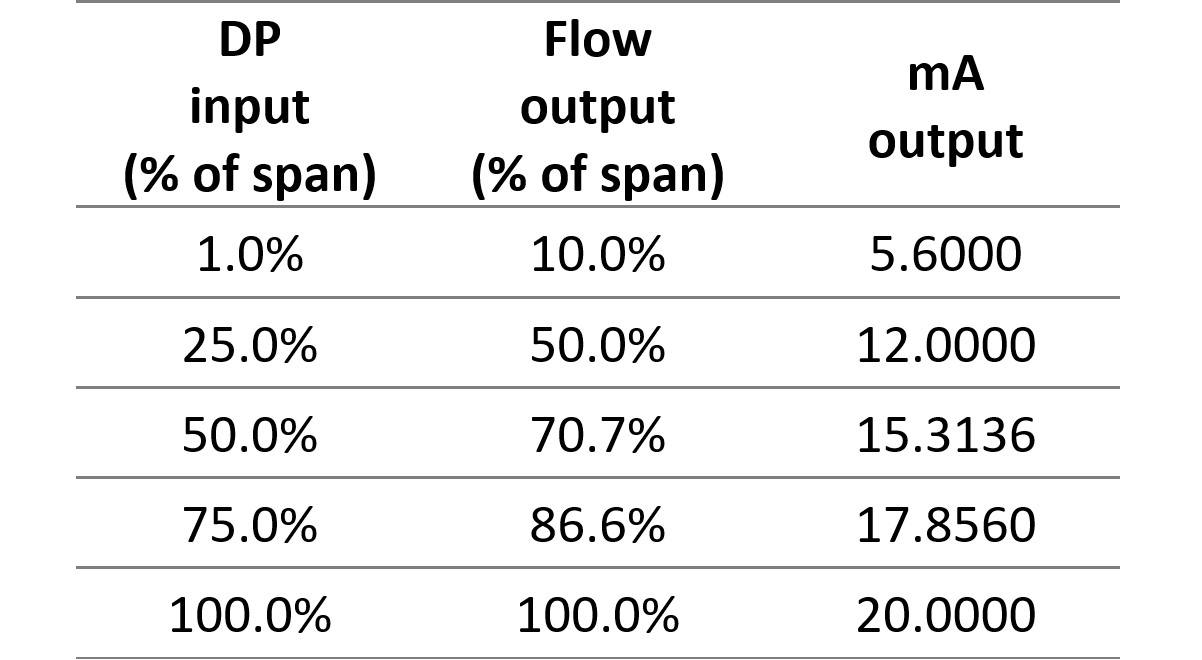
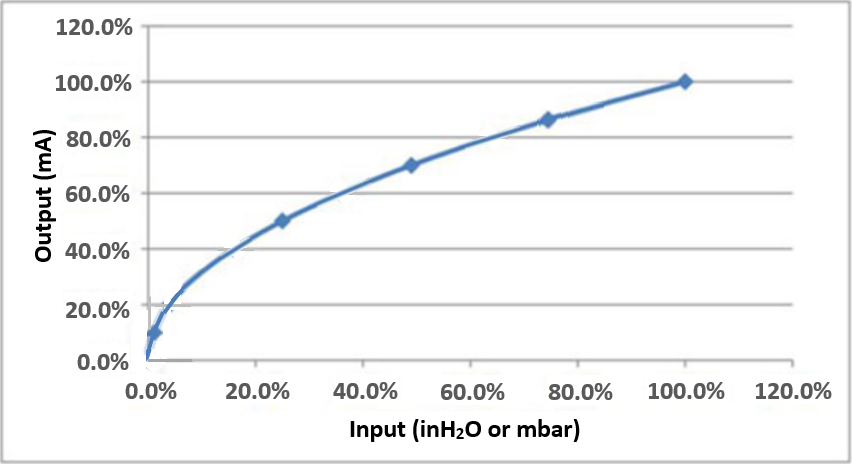
From this equation, we can see that an increase in differential pressure will result in an increase in flow rate. However, the relationship between flow rate and differential pressure is not linear but square-rooted, as you can see from the diagram below.
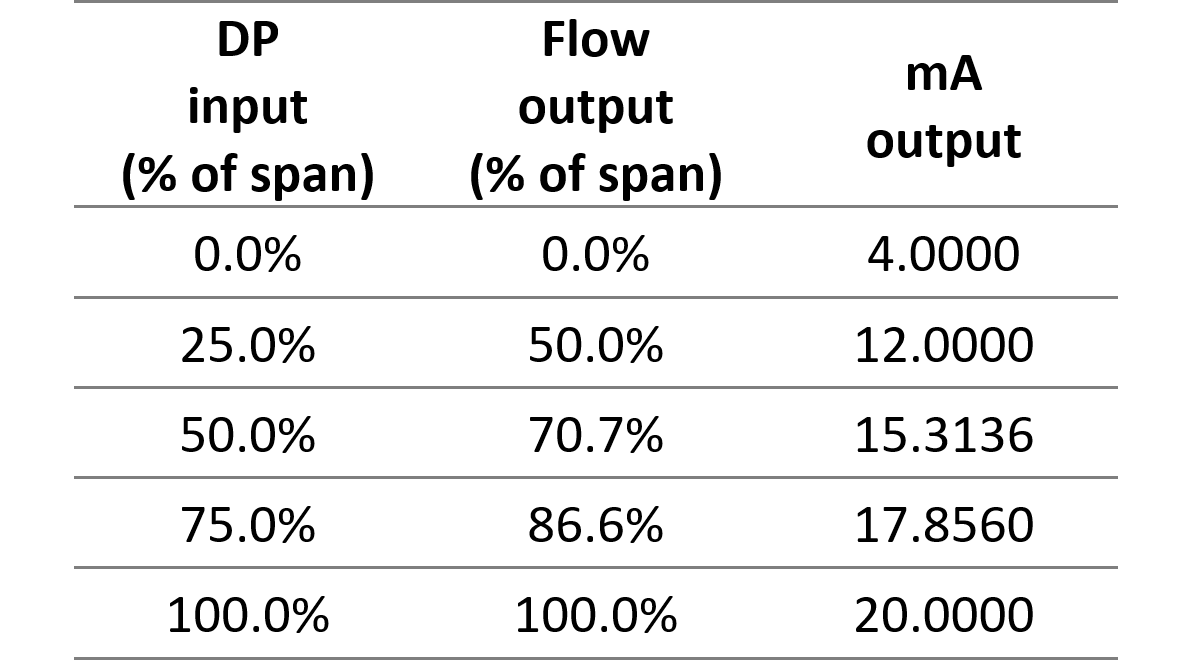
A 25% increase in differential pressure will result in a 50% increase in flow rate.
Low-flow Cut-off
Let’s have another look at the DP vs Flow curve above. Check in particular how the curve behaves in the region around the origin.
In this region, the slightest change in differential pressure causes the flow to change rapidly. A little noise on the DP signal gets multiplied by a factor of 10 or more on the flow signal.
This makes the flow signal very unstable and unreliable. Therefore, vendors will define a low-flow cut-off for the flow meter. That means that the output signal will be set to 4mA once the flow drops below 10%.
The low-flow cut-off is only present in DP transmitters with internal square root extraction. If the square rooting is done by the PLC/DCS, then the DP transmitter has a linear output and the low-flow cut-off should be programmed in the PLC/DCS.
A low-flow cut-off at a flow rate of 10% corresponds to an output of 5.6 mA. So, between 4 and 5.6 mA there is no useful measurement possible because of too much inaccuracy.
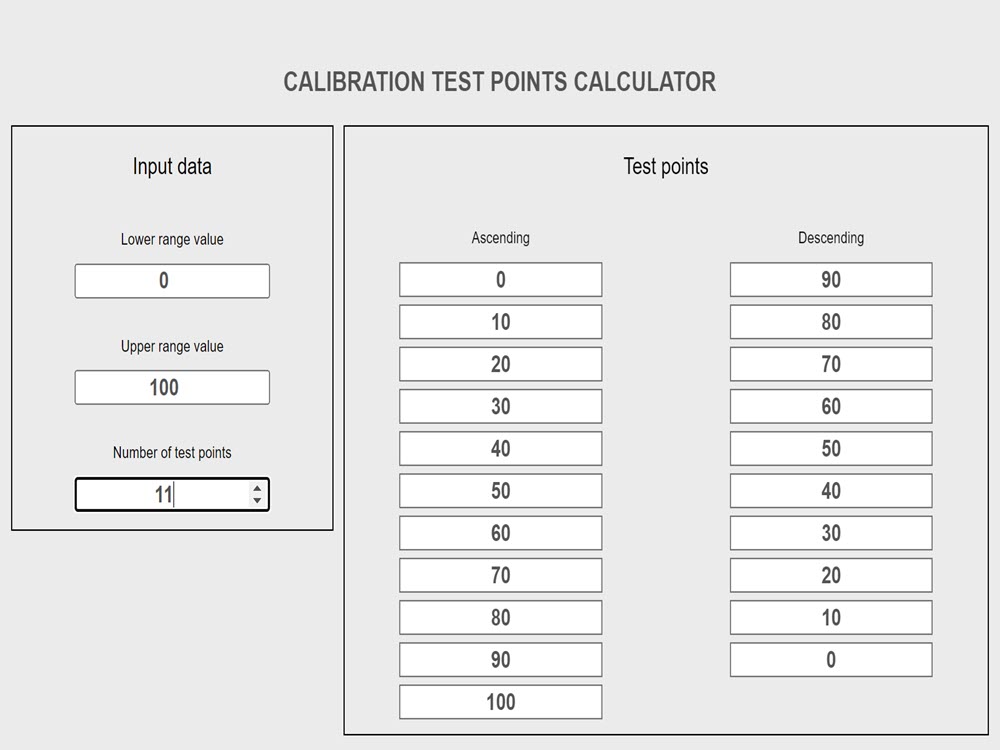
All of that will have consequences on the calibration of our DP flow transmitter. For a typical five-point calibration of a transmitter with linear output, the test points would be 0, 25, 50, 75, and 100% of the flow rate. But, if the DP flow transmitter performs the square root calculation and a Low-Flow Cut-Off is considered, it has no sense to have a test point below 10% of the flow rate. So, the test points should be 10, 25, 50, 75, and 100% of the flow rate.
What are the tools needed to calibrate a DP type flow transmitter?
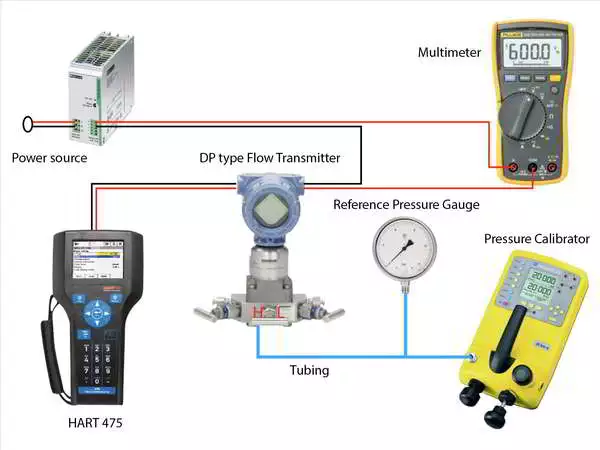
Besides the DP flow transmitter itself, we will need the below-mentioned tools to perform a calibration:
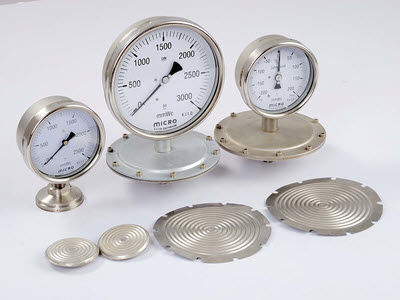
- A calibrated pressure calibrator capable of indicating pressure in mmH2O, because here the DP transmitter for measuring flow has a range in mmH2O.
- A calibrated pressure gauge of the appropriate range.
- A 24Vdc power supply (if the pressure transmitter is not connected to the system and needs an external power supply)
- A digital Multimeter
- A HART communicator
Some important things to consider before starting the calibration of a DP-type flow transmitter
- Check all the tools mentioned above. Check their calibration date’s validity and ensure they are charged one day before planning the job.
- Obtain a work permit with all risk assessments performed.
- Make sure you have the datasheet of the DP flowmeter when performing the calibration task.
- Go through the C&E (Cause and Effect Matrix) and bypass all the interlocks present for the DP-type flow transmitter. Follow the proper bypass procedure and fill out all necessary interlock bypass requests.
- Inform all involved process operators at the start of the calibration job.
The DP type flow transmitter calibration procedure
When all the preparatory work has been completed, we can now start calibrating the DP flow transmitter.
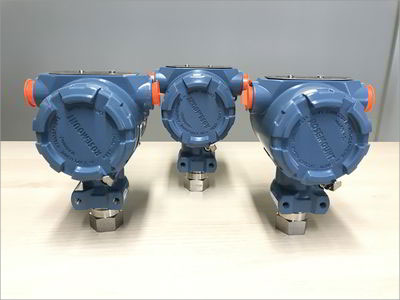
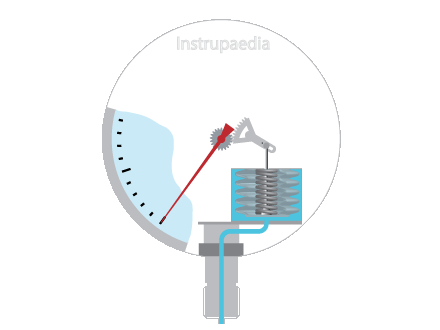
- Arrange all the tools as shown in the above figure.
- The DP-type power transmitter can be powered through the field cables connecting the DP transmitter to the system, or by using an external power supply shown in the figure.
- If the differential pressure flow transmitter is in the field, then isolate the DP transmitter. Flush the differential pressure transmitter in a closed drain if it comes into contact with a dangerous process medium like a hazardous chemical.
- Connect the power supply, the multimeter, and the DP flow transmitter in a series configuration. Make sure to connect the multimeter leads to the mA terminal and the common terminal.
- Now connect the DP transmitter to the pressure calibrator using the appropriate tubing. Here we can use PU tubing because the pressure to be applied to the DP flow transmitter is in the mmH2O range.
- Connect a precision pressure gauge of appropriate range to the pressure-generating device if for any reason this device would not display the generated pressure.
- Prior to starting the calibration, it is necessary to determine whether the square root extraction takes place in the DP transmitter or in the PLC/DCS. The output value (mA) of the DP transmitter will depend on where this square root extraction occurs. So, check the datasheet or the configuration parameters of the DP transmitter to see if the transmitter does the square root extraction. A third option is to simulate 25% of the DP range with the pressure calibrator and look at the output (mA) of the DP transmitter:
- If the output is about 12mA, the sqrt extraction is performed by the transmitter.
- If the output is about 8mA, the sqrt extraction is performed by the PLC/DCS.
- Let’s take an example to see what we can expect. Imagine a DP flow meter with the following ranges:
* Flow range: 0 – 1000 m3/h
* DP range: 0 – 5000 mmH2O
We want to do a five-point calibration of the transmitter‘s mA output.
Now there are 2 possibilities: the square root is done in the transmitter, or it’s done in the PLC/DCS.
Let’s have a look at both possibilities.- If the transmitter performs the square root extraction, we have a mA output representing the flow rate.
So since we want to calibrate the transmitter’s output, we will have to distribute our test points evenly over the output range. Considering what we said earlier about the inaccuracy at the low flow range, we will test for 10%, 25%, 50%, 75%, and 100% of the flow range.
We will arrange these values in the table below and add the corresponding DP-values and mA-signals.
- If the transmitter performs the square root extraction, we have a mA output representing the flow rate.
| Test points | Flow (%) | Flow (m3/h) | DP (mmH2O) | Output (mA) |
|---|---|---|---|---|
| TP1 | 10 % | 100 | 50 | 5,6 |
| TP2 | 25 % | 250 | 312.5 | 8 |
| TP3 | 50 % | 500 | 1250 | 12 |
| TP4 | 75 % | 750 | 2812.5 | 16 |
| TP5 | 100 % | 1000 | 5000 | 20 |
The values in the DP (mmH2O) and Output (mA) columns have been calculated with the following formulas:
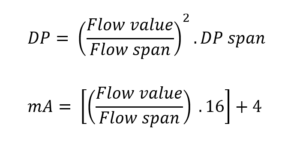
Flow value = flow rate at the test point
Flow span = 1000
DP span = 5000
-
- If the PLC/DCS performs the square root extraction, we have a mA output representing the measured DP.
In this case, if we want the test points evenly distributed over the output, we will test for 0%, 25%, 50%, 75%, and 100% of the DP range.
We will arrange these values in the table below and add the corresponding Flow values and mA-signals.
- If the PLC/DCS performs the square root extraction, we have a mA output representing the measured DP.
| Test points | Flow (%) | DP (mmH2O) | Flow (m3/h) | Output (mA) |
|---|---|---|---|---|
| TP1 | 0 % | 0 | 0 | 4 |
| TP2 | 25 % | 1250 | 500 | 8 |
| TP3 | 50 % | 2500 | 707,1 | 12 |
| TP4 | 75 % | 3750 | 866 | 16 |
| TP5 | 100 % | 5000 | 1000 | 20 |
The values in the Flow (m3/h) and Output (mA) columns have been calculated with the following formulas:
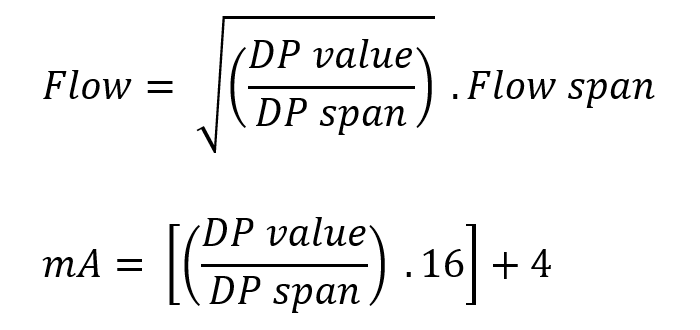
DP value = DP at the test point
DP span = 5000
Flow span = 1000
- Now that we know where the square root extraction is done and we have calculated our test points, we can start the validation procedure. We will do an ‘As Found’ test on all test points.
This test is done for two reasons:- If this test proves that the instrument is still within the required accuracy for the application then we do not have to recalibrate it.
- With this test, we will record the history of the device performance data. This will be helpful to decide if we need to shorten or prolong the calibration frequency.
- We will use the following table for our ‘As Found’ test:
| Test Points | Applied | Transmitter output | Error %reading | ||
|---|---|---|---|---|---|
| DP (mmH2O) | Flow (m3/h) | DP (mmH2O) | Flow (m3/h) | ||
| 50 | |||||
| 312,5 | |||||
| 1250 | |||||
| 2812,5 | |||||
| 5000 | |||||
| 2812,5 | |||||
| 1250 | |||||
| 312,5 | |||||
| 50 | |||||
- I have filled in our test points based on a dp transmitter with square root extraction.
- You can see that our test points are going in ascending order from minimum to maximum value and then in descending order back to minimum. This is important because the results can be different for the same test point when approached from below or from above. So, be very careful when approaching a test point not to overshoot it because if you have to come down again it will not give you the same result.
- Start the validation procedure with zero pressure on the pressure calibrator and increase the pressure until you reach the pressure value of the first test point. Note down the reading from the pressure calibrator in the second column ‘Applied DP’ and the reading from the transmitter in the fifth column ‘Transmitter output Flow’.
Similarly, apply the pressures of the other test points in the order they appear in the table. Note down the readings from the pressure calibrator and the transmitter in the appropriate columns.
Every time you reach a new test point, the applied pressure value should remain stable for 30 seconds before reading the output value from the transmitter. If the pressure drops during these 30 seconds, then there is a leakage in the tubing or an issue with the pressure calibrating device. Identify the root cause and attend to it. - As the square root extraction is done by the transmitter, its output represents the flow rate. To calculate the error on the output, we will have to compare the measured flow rate with the applied flow rate. As we can only apply a DP, we will have to calculate the applied flow with the following formula:
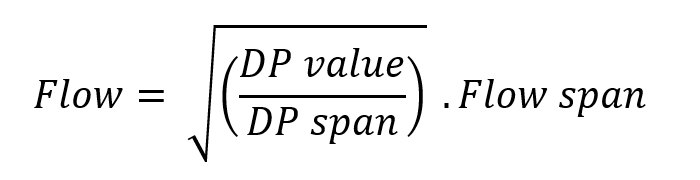
- Do this calculation for every test point and fill in the flow rates in the third column ‘Applied Flow’.
- Now calculate the error % from the Flow values we got with the next formula:
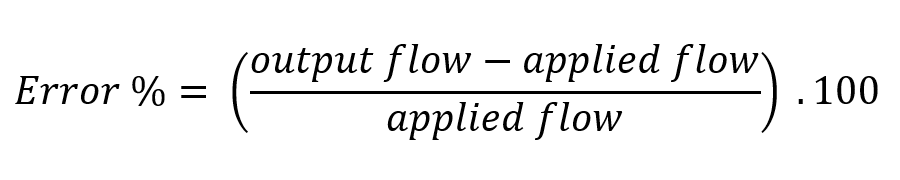
- If the calculated errors are all well within the required accuracy for the application, then the DP type flow transmitter is ok and should not be recalibrated. If the error obtained from the calculations is more than the required accuracy for the application then a calibration of the DP flow transmitter is needed.
- A recalibration of a dp flow transmitter with internal square root extraction consists of a lower trim at the 10% flow point and a span trim at the 100% flow point. We can not do a zero trim for a transmitter with square root extraction because the zero point is too unstable. Any fluctuation in the input signal, no matter how small, is multiplied tenfold at the output.
First, apply 1% DP on the input of the transmitter and check if this corresponds to 10% flow at the output. If this is not ok then start a lower trim at the 1% input / 10% output level (not zero) using the HART communicator. - Now check the 100% flow point by applying the 100% DP pressure to the input of the transmitter. If the reading does not indicate 100% flow, perform a span trim using the HART calibrator.
- When the lower trim and span trim is completed, the transmitter is calibrated. To check whether everything went well and whether the transmitter will measure correctly, we will now do an ‘As Left’ verification.
Repeat the procedure from step 9 to the end. Set up the ‘As Left’ table with the same test points as those from the ‘As Found’ table.
If the calculated errors from the ‘As Left’ table fall within the required accuracy for the application, the calibration is successful. - All that remains is to return the transmitter to service. Inform the operator that the DP flow transmitter calibration job is finished and remove any interlock bypasses you placed at the start.
Why a differential pressure flow transmitter needs to be calibrated
All instruments need to be recalibrated over time. A DP flow meter makes no exception to that rule. A slight progressive accuracy degradation also called drift is the reason for these recalibrations. Drift is caused by the aging of the material and the wear and tear on mechanical and electronic components.
The sensor of the transmitter can be considered as a mechanical component. During its lifetime, this sensor will be subjected to constant pressure fluctuations, causing it to be repeatedly tensioned and released. This can eventually lead to small deformations causing small inaccuracies. The same can happen to the diaphragm that separates the sensor from the process, the body of the pressure transmitter, …
The transmitter’s electronics also age under the influence of temperature fluctuations, humidity, mechanical shock, or vibration… which changes the processing of signals over time.
To compensate for all these small changes, we occasionally need to recalibrate the transmitter.
Factors affecting the DP flow transmitter calibration frequency
- Process functionality and importance of the flow measurement
When the differential pressure flow meter is part of a flow control loop, it will be more important than if it is only used for indicating flow on the control panel. More important measurements should be calibrated more often. - Operating conditions
If the DP transmitter is frequently required to operate close to its operating limits, the deviation of the output signal will be greater over time. - The quality of the instrument
Differential pressure transmitters fabricated with the latest technology, using high-standard components will drift much less than lower-quality instruments. Therefore their calibration interval will be longer. The best ones can reach a calibration interval of 5 to 10 years. - Regulations and standards
Because regulations and standards don’t know what type of instrument you are using and what your application is, they do not give you the exact calibration frequency for the instrument, but they do give you a measurement accuracy that you need to achieve. Based on that information, you then have to determine for yourself which calibration interval will be required. - Manufacturers recommendations
If you bought an instrument from a reputable manufacturer, the manual should normally state the calibration interval. Of course, this is only a recommendation from the manufacturer who does not know what application you are using the instrument for. It gives you the ideal calibration interval for using the instrument under normal operating conditions. If you have no experience with your application, this is a good value to start with.
How often should you perform a DP flow transmitter calibration?
When you install a DP flow meter on a new application, you want to have an idea of when you will need to recalibrate it. Well, there is a way to determine the calibration interval by calculation.
I’ll show you how to do it.
First, you need to decide on the accuracy required for your application, and by required accuracy I don’t mean the reference accuracy of the DP transmitter but the total performance of the installed measurement.
Errors that occur through ambient temperature changes and high static pressure on the differential pressure transmitter should therefore be taken into account.
Generally, for pressure transmitters, the total installed performance will be between 0,5 and 2,0% of calibrated span. Here is a short list of applications with their required installed performance to help you make your choice:
| ● Plant safety and efficiency control | 0,5% |
| ● Regulatory control | 1,0% |
| ● Supervisory control | 1,5% |
| ● Monitoring | 2,0% |
Once you have determined the installed performance, I want you to calculate the total probable error with this formula:
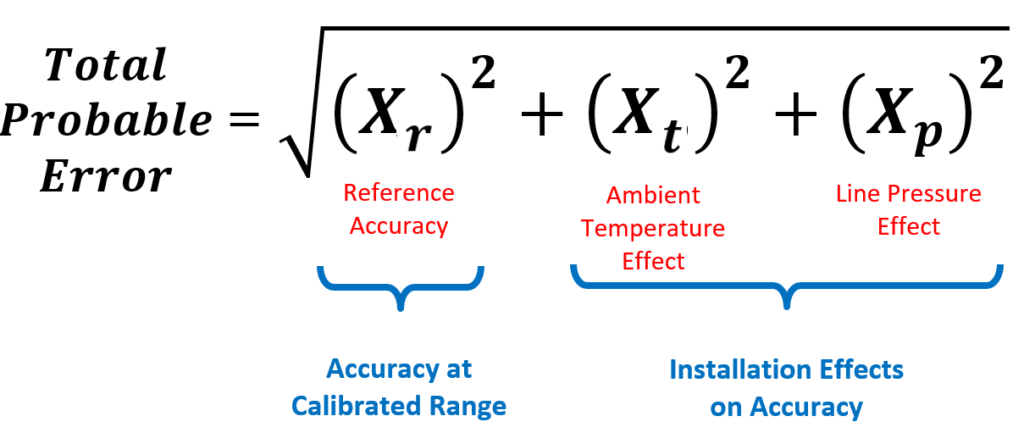
To populate the equation you will need to dive into the published specifications of the differential pressure transmitter.
The reference accuracy will be given in % of span. Find that number and put it in the formula.
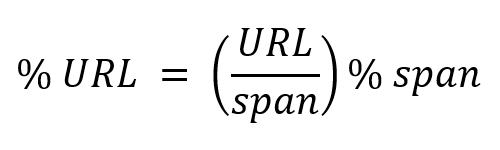
The ambient temperature effect can be given with a formula where a part of it is expressed in the unit ‘% URL’ and another part in the unit ‘% span’. When this is the case, you should convert the unit ‘% URL’ to the unit ‘% span’ as follows:
The static pressure effect also called the line pressure effect, could be given as a % of reading. Because we have to convert everything to % of span, we will simply consider the pressure reading at full span. This way, we can just keep the percentage value and replace the unit ‘% of reading’ with ‘% of span’.
Now, populate the above formula with the 3 results we have found and calculate the Total Probable Error.
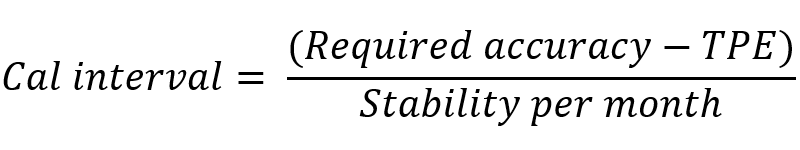
The next thing to do is to search for the stability specification of the output. This will be given as a % of URL for a number of years, meaning that the instrument will lose accuracy at a certain % of URL over the stated number of years.
You should now convert the stability specification to engineering units, like e.g. inH2O, by replacing URL with its pressure value. This gives the stability in engineering units over a number of years. From this, you can calculate the stability per month instead of over a number of years.
Finally, you have to convert the required accuracy for your application and the total probable error to engineering units by replacing the word span with the value of the span.
By using the following formula with the engineering units, you will find the calibration interval in months.
Related topics
2 Comments
Leave a Comment
Your email address will not be published. Fields marked with * are required.


I appreciate your lessons. I want to learn instrumentation
Thanks for your appreciation.