Select the unit you want to convert from in the input unit list on the left.
Select the unit you want to convert to in the output unit list on the right.
Enter the value of the input unit to convert from in the input box on the left.
The tool will immediately display the equivalent value of the output unit in the output box on the right.
Steps 1 to 3 may be executed in random order.
The value of your input unit can be converted to any other unit by just selecting a different output unit in the list on the right.
What you need to know about temperature units
Only 5 temperature scales are still in use today. In the past, however, many other scales were used. One by one, these scales fell into disuse and were replaced by modern scales with better characteristics. If you want a little more background about the origin of the temperature scales, both old and modern, then this article about temperature scales is made for you.
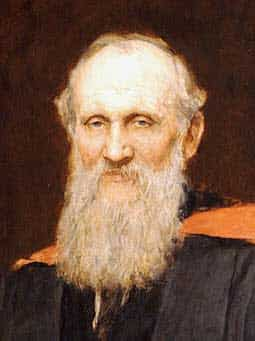
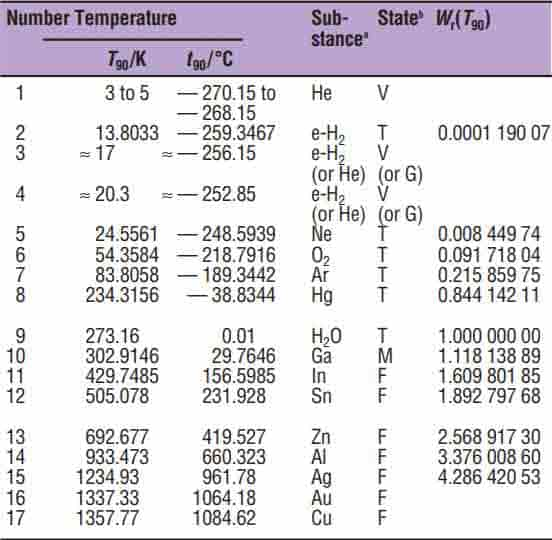
The Kelvin scale, invented by Lord Kelvin, is an absolute temperature scale that is used almost exclusively for scientific purposes. The zero point has been chosen at the lowest temperature possible. This is the point where the kinetic energy of all atoms is zero, which is the same as saying that they are not moving anymore. In other words, everything is frozen solid. The size of the divisions on the Kelvin scale corresponds exactly to those on the Celsius scale. Negative temperatures do not appear on the Kelvin scale because scientists believe that absolute zero is the coldest possible temperature. Kelvin is the base unit for temperature according to the International System of units.
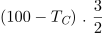
The Celsius scale, created by Anders Celsius in 1742, is the most widely used scale on Earth. The scale is defined by the freezing and boiling point of water (at sea level), marked with 0°C and 100°C respectively. There are 100 divisions between these reference points, hence the name “centigrade scale” which is sometimes used when referring to this scale.
The Fahrenheit scale, an invention of Daniel Gabriel Fahrenheit, is, just like the Celsius scale, a relative temperature scale because the freezing and boiling point of water is chosen as the two fixed points on the scale. The freezing point is set to 32°F, while the boiling point is at 212°F (at sea level). There are 180 divisions between the two points which makes it a little bit more accurate. The scale is, however, only used in the United States, Belize, Liberia, and Myanmar.
The Rankine scale, developed by William John Macquorn Rankine, is an absolute scale only used in the scientific field of thermodynamics when formulas are expressed in Imperial Units. It starts at absolute zero and every division has the same size of a degree Fahrenheit. As with the Kelvin scale, negative numbers are impossible.
The Réaumur scale, made by René Antoine Ferchault de Réaumur, has only one reference point being the freezing point of water, which is set at 0°Ré. Water boils at 80°Ré. Today, this scale is still in use in some parts of the food industry, e.g. for cheese production or cooking sugar syrup.
Some remarkable temperatures
°C
°F
K
Absolute zero
-273.15
-459.67
0
Freezing point of water
0
32
273.15
Triple point of water
0.01
32.018
273.16
Human body temperature
37.0
98.6
310.15
Boiling point of water
100
212
373.15
Conversion formulas
Convert to Celsius
Fahrenheit
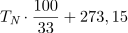
(TF – 32) x 5/9
Kelvin
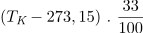
TK – 273.15
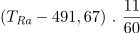
Rankine
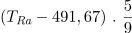
(TRa – 491.67) x 5/9
Reaumur
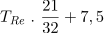
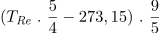
TRe x 5/4
Convert to Fahrenheit
Celsius
(TC x 9/5) + 32
Kelvin
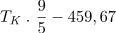
(TK x 9/5) – 459.67
Rankine
TRa – 459.67
Reaumur
(TRe x 9/4) + 32
Convert to Kelvin
Celsius
TC + 273.15
Fahrenheit
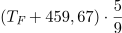
(TF + 459.67) x 5/9
Rankine
TRa x 5/9
Reaumur
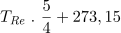
(TRe x 5/4) + 273.15
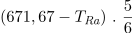
Convert to Rankine
Celsius
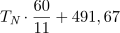
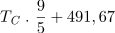
(TC x 9/5) + 491.67
Fahrenheit
TF + 459.67
Kelvin
TK x 9/5
Reaumur
(TRe x 5/4 – 273.15) x 9/5
Convert to Reaumur
Celsius
TC x 4/5
Fahrenheit
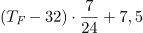
(TF – 32) x 4/9
Kelvin
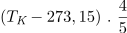
(TK – 273.15) x 4/5
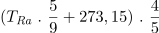
Rankine
(TRa x 5/9 + 273.15) x 4/5
Body temperature of humans compared to warm-blooded animals
Species
°C
°F
Elephant
36.5
97.7
Human
37.0
98.6
Horse
38.0
100.4
Baboon
38.1
100.6
Rabbit
38.3
101.0
Cow
38.6
101.5
Dog
38.9
102.0
Cat
39.0
102.2
Pig
39.0
102.2
Sheep
39.0
102.2
Goat
39.7
103.4
Duck
40.7
105.3
Camel*
34.5 – 41.0
94.1 – 105.8
Chicken
42.0
107.6
*
The camel’s body temperature will vary with the time of day and water availability. When a camel is watered daily, its body temperature rises from 36.5°C (97.7°F) in the morning to 39.5°C (103.1°F) at noon, if the animal has no water, the temperature range is 34.5°C (94.1°F) to 41°C (105.8°F).
Fun facts about temperature
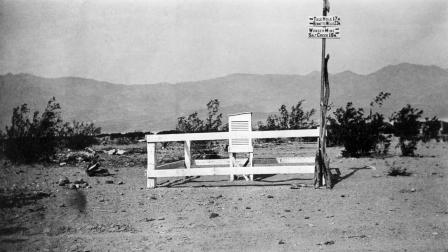
The hottest air temperature ever registered on Earth, and approved by the World Meteorological Organization (WMO), was 56.7°C (134.1°F). This record temperature was measured in Furnace Creek (what’s in a name), Death Valley, California, USA on 10 July 1913.
Furnace Creek temperature station / , courtesy of ASU
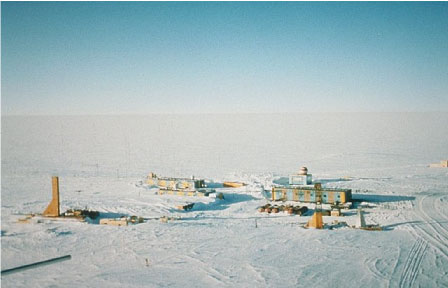
If you prefer cold rather than heat, check this cold record. On July 21, 1983, the mercury plunged to -89.2°C (-128.6°F) at Vostok Station, the Russian research station in Antarctica.
Vostok research station
The fastest ever temperature drop was recorded on 10 January 1911, at Rapid City, South Dakota, USA, where the temperature dropped by 26.1°C (47°F) in just 15 minutes when an intense arctic cold front rushed over the city. The temperature at 7 am was 12.8°C (55°F) and plummeted to -13.3°C (8°F) shortly after.
If you think this is crazy, than see what happened to a city nearby called Spearfish, South Dakota, USA. At 7:30 am on 22 January 1943 it was a chilling -20°C (-4°F), but it took a Chinook wind only 2 minutes to raise the temperature to 7.2°C (45°F). A temperature increase of 27.2°C (49°F) in just 2 minutes.
The temperatures in outer space are not the same everywhere. Depending on the amount of energy that is available at a certain location, the matter will be heated up more or less. In the large area between the galaxies, the temperature of a gaseous matter reaches its minimum of 3K (-270.15°C / -454.27°F). That’s because the gas is so thin that there are not enough particles that bump into each other and transfer heat.
However, if that same gaseous matter would be located between nearby stars, it’s temperature could rise to a thousand or even millions of degrees (in any unit you like).
The surface temperature of our sun is 5500°C (10000°F) although it is not the same everywhere on the surface. Some parts of the sun’s surface are darker and cooler than others. These places are called sunspots. In the middle of such a large sunspot, the temperature can drop to 4000°C (7250°F).
At the core of the sun, the temperature can reach up to 15 million °C (27 million °F).
Advertisement
Pressure units converter
Convert bar to psi, psi to bar, MPa to psi …
UnitConversion.org – the universal assistant for all of your unit conversion needs.
Select the unit you want to convert from in the input unit list on the left.
Select the unit you want to convert to in the output unit list on the right.
Enter the value of the input unit to convert from in the input box on the left.
The tool will immediately display the equivalent value of the output unit in the output box on the right.
Steps 1 to 3 may be executed in random order.
The value of your input unit can be converted to any other unit by just selecting a different output unit in the list on the right.
The most frequently used pressure units
The world’s most frequently used pressure units are:
pascal (Pa): this is the SI unit
kilopascal (kPa)
megapascal (MPa)
pound per square inch (psi)
atmosphere (atm)
torr (mmHg)
bar
Pressure conversion factors
The conversion factors to convert between the most frequently used pressure units can be found in the table below:
CONVERT TO (multiply by)
pascal
kilopascal
megapascal
pound square inch
atmosphere
torr
bar
CONVERT FROM
(Pa)
(kPa)
(MPa)
(psi)
(atm)
(mmHg)
(bar)
pascal (Pa)
1
103
106
1.4503×10⁻⁴
9.8692×10⁻⁶
7.5006×10⁻³
10-5
kilopascal (kPa)
10-3
1
103
0.1450
9.8692×10⁻³
7.5006
10-2
megapascal (MPa)
10-6
10-3
1
145.0377
9.8692
7500.6168
10
Pound square inch (psi)
6894.7572
6.8947
6.8947×10⁻³
1
0.0680
51.7149
6.8947×10⁻²
atmosphere (atm)
1.0132×10⁵
1.0132×10²
0.1013
14.6959
1
760
1.013
torr (mmHg)
133.3223
0.13332
1.3332×10⁻⁴
1.9336×10⁻²
1.3157×10⁻³
1
1.3332×10⁻³
bar
105
102
0.1
14.5037
0.9869
750.0616
1
Some factors are slightly rounded compared to the factors used in the Pressure Units Converter.
Manometric units of pressure
Units like millimeters of mercury or centimeters of water are called manometric units. These units depend on an assumed density of a fluid and an assumed acceleration due to gravity.
Most of these units are based on the following assumptions:
standard gravity at sea level and 45° latitude:
9.80665 m/s2 (32.17405 ft/s2)
density of pure water at one of below temperatures:
4°C (39.2°F) = 1000 kg/m3 (1.9403 sl/ft3)
60°F (15.6°C) = 1.9385 sl/ft3 (999.07 kg/m3)
density of pure mercury at one of below temperatures:
0°C (32°F) = 13595.1 kg/m3 (26.3788 sl/ft3)
60°F (15.6°C) = 26.3071 sl/ft3 (13558.14 kg/m3)
Manometric units must be used with caution as they are influenced by latitude and temperature.
Because the shape of the Earth is not a perfect sphere but is flattened at the poles, the acceleration due to gravity depends on latitude. The Earth’s radius is smaller at the poles than at the equator. Therefore, gravity is greatest at the poles and least at the equator.
When these units are used under non-standard conditions of latitude and temperature, a correction must be applied to convert the measurement result to standard conditions.
National standard organizations discourage the use of manometric units because of the complexity that results from converting to standard conditions as well as the existence of different conventions used for the temperature and density of the liquid.
Advertisement
NAMUR NE43 standardization of 4–20mA signal levels
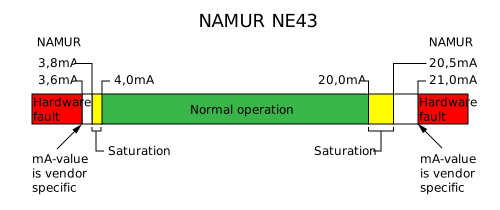
Namur alarm and saturation levels
The 4-20mA analog signal is a widely spread standard in the industry for several good reasons. This type of signal is used by the majority of transmitters, PLCs, and distributed control systems.
The 4mA and 20mA levels correspond exactly to the lower and upper range values of the transmitter’s measurement range. A variation of their output current between 4 and 20mA means that the transmitter is working perfectly fine and the process value to be measured is within the measurement range.
But how should the output
signal behave if the process value falls outside the measuring range or if the
transmitter fails?
The Namur NE43 is a recommendation that gives a guideline on how a sensor fault can be indicated to a control system by means of the 4-20mA signal.
It,
therefore, defines two signal levels outside of the normal operation range:
Out-of-range level (saturation)
Hardware fault level
Out-of-range signal level
When an
instrument is calibrated and working properly, its output signal should stay
between 4mA and 20mA for as long as process conditions are normal. But
sometimes it happens that the process conditions deviate from the normal
operation, such as the overfilling of a tank.
In this
case, a NAMUR compliant transmitter can output up to a maximum of 20.5 mA. Its
output signal is then out-of-range and located in the saturation region.
A
similar but smaller saturation area is located at the bottom of the measuring range.
Another reason why an output signal may be in the saturation area is that analog signals drift over time. The low range value of the process normally corresponds to 4 mA after calibration, but within a few years, the output signal may drift, leaving the transmitter to send only 3.9 mA.
Hardware fault signal level
Smart
measurement devices are capable of detecting internal faults, like a sensor or
a converter failure.
When
that happens, the microprocessor of a NAMUR compliant instrument will set the
output signal to 3,6mA or 21,0mA, depending on how the user has set the
fail-safe mode.
A lot of smart field devices will have a fail-safe mode parameter that will let you choose between downscale or upscale failure mode, as per the NAMUR NE43 recommendation.
Upscale means that the output current
will be set to 21mA in case the internal diagnostics
detect a fault.
Downscale
means the output will be set to 3,6mA.
There
is only a 0,2mA gap between the 3,6mA downscale fault signal level and the
3,8mA start value of the low saturation area because a 2-wire transmitter uses
the current below 3,6mA for its own proper operation. Some manufacturers also
have measuring devices that consume less than 3.6 mA.
If you use 2-wire transmitters, it is therefore recommended to set the hardware fault signal level to 21.0 mA to avoid problems with the operation of the devices at a very low current.
For 4-wire transmitters, setting the hardware fault signal level to 3,6mA is not a problem since they are not loop-powered.
Interpretation of alarm threshold levels by the control system
Ideally, the receiving controller should have an input module with a suitable software block that can interpret the input signal within a current range between at least 0 and 22mA.
By the NAMUR definition, signals between 3,6 and 3,8mA as well as between 20,5 and 21,0mA cannot occur (see white areas in the above diagram). But if for some reason they do occur, the control system should interpret them as the measurement signal rather than a fault signal.
That
leaves the current signal ranges ≤ 3,6mA and ≥ 21,0mA to be
interpreted as a hardware fault of the transmitter.
In
order to avoid false alarms, the hardware fault signal shall be present for at
least 4 seconds and a minimum of 2 signal scanning cycles before it is
interpreted as a sensor fault.
If the alarm
threshold is exceeded, the control system can respond to this by taking one of
the following actions, for example:
Adjust or stop the production to avoid production loss or off-spec product
Automatically notify a maintenance technician to repair or replace the failed transmitter
Switch the defective control loop to manual mode
…
Vendor-specific fail-safe signal levels
Not all instrument
manufacturers follow the NAMUR NE43 recommendation to the letter. Their self-declared
“NAMUR compliant” transmitters use deviating values for the hardware fault
signal levels.
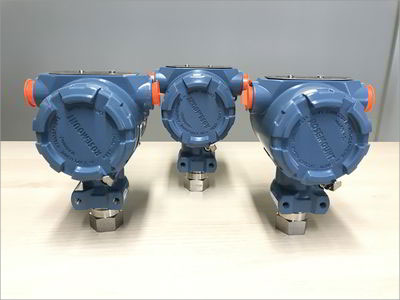
The hardware fault signal levels may differ according to the transmitter type, even when these transmitters are made by the same manufacturer. This is, for instance, the case with Rosemount where the upscale failure mode for a pressure measuring device differs from that for a temperature measuring device, as can be seen in the table below.
Some examples
of alarm threshold levels for different manufacturers:
A potentiometer is
an electrical component that is used as a voltage divider. It consists of:
a resistive element with electrical terminals on both ends
a wiper that can move along the resistance path and makes contact with it through sliding contacts
a third electrical terminal connected to the wiper
a housing that contains both the resistive element and the wiper
When a voltage is applied to the ends of the resistive element, a
part of that voltage can be tapped by the wiper.
The position of the wiper on the resistance path determines the amount of tapped voltage.
How a potentiometer works
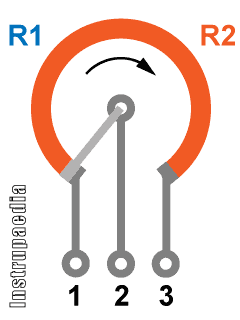
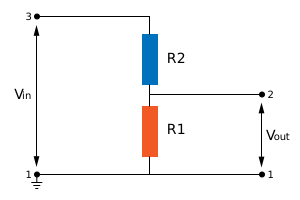
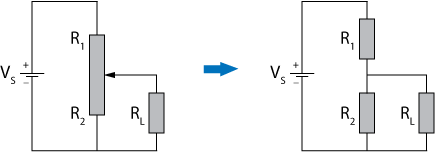
A potentiometer can be considered as two variable resistors in series, with the wiper connected in between the two resistors.
When the wiper is turned to the right, R1 becomes larger and R2 becomes smaller.
Conversely, if the wiper is turned to the left, R1 will decrease and R2 will increase.
Start the animation below to see how that works out.
Potentiometer animation
Schematically, you can simply
imagine a potentiometer as follows:
If you apply a voltage to pins 1 and 3, the potentiometer will make sure that voltage is divided over the resistors R1 and R2.
How much voltage will be across
each of these resistors depends on their resistance.
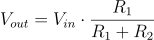
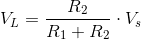
When no load is connected to
pins 1 and 2, Vout can be calculated with the formula:
The output voltage will be
slightly different when a load would be connected because the resistance of the
load RL and the resistance of R1 will then be in parallel. So, the output voltage
would then be calculated with the following formula:
What are potentiometers used for?
The best-known application of potentiometers is for volume control of audio devices. Radios and old-style televisions use a potentiometer with a knob to increase or decrease the volume.
However, potentiometers can
also be used to control the output frequency of a circuit, the rotational speed
of a motor, or to balance or calibrate a circuit.
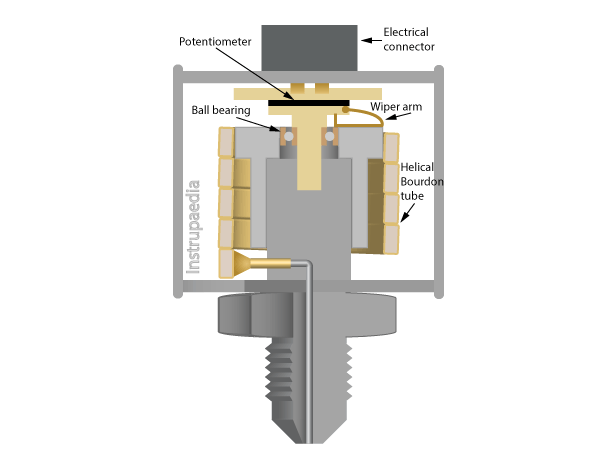
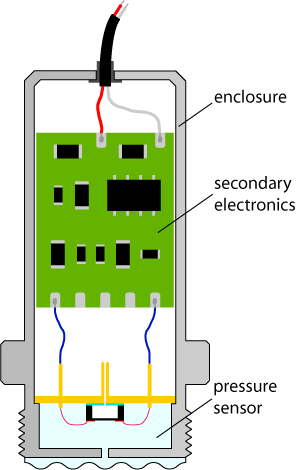
Because they are relatively cheap and relatively easy to manufacture, they are also often used as a sensor in measuring devices such as the potentiometric pressure transducer or the position feedback for on/off and control valves.
There are many more
applications for potentiometers.
In general, we can say that they are used when something needs to be adjusted or controlled.
How to connect a potentiometer?
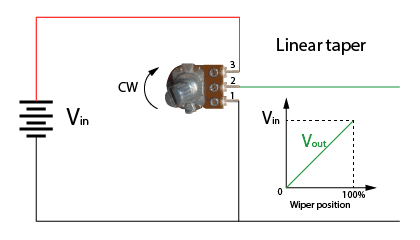
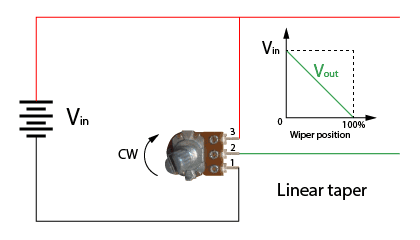
If you use it as a voltage divider, connect pin 1 to the ground and the positive potential of the source to pin 3. The wiper of the potentiometer is always connected to pin 2.
With the load wired between pin 1 and 2, the voltage over the load will increase when turning the potentiometer clockwise.
With the load wired between pins 2 and 3, the voltage over the load will decrease when turning the potentiometer clockwise.
Yes and no, it all depends on how
much power needs to be supplied.
A rheostat is nothing more than a variable resistor. Unlike a potentiometer, which adjusts the voltage, the purpose of a rheostat is to adjust the current. That is why they are often made of robust wirewound resistors.
Potentiometers, on the other hand, are not made to handle large currents. They are more fragile and must be treated with care.
So, in fact, you could use a potentiometer
as a rheostat, but only if the current flowing through it, remains low enough
to avoid damaging the potentiometer.
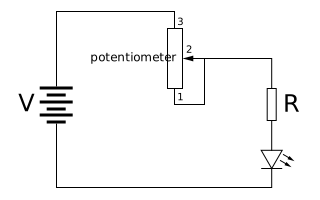
The above diagram shows a potentiometer, wired as a rheostat, to adjust the current flowing through a light-emitting diode (LED).
The connection between pins 1 and 2 of the potentiometer is not really necessary. It is, however, best practice to make this connection to avoid an open circuit when the wiper loses contact with the resistive track. At the same time, it also reduces noise during the adjustment of the rheostat.
The extra resistor R serves to
protect the LED against overcurrent when the resistance of the rheostat is set
to zero.
How to test a potentiometer?
If in doubt whether a
potentiometer is still in good condition, it is advisable to test it for two
things:
check whether its total resistance value is still correct
check whether its resistance path is free from interruptions
Both conditions are easy to
test if you follow the next two steps.
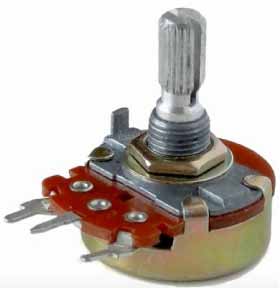
Step 1: Find out which pin is
connected to the wiper
If you already know how the
pins are connected inside the potentiometer, you can go straight to step 2. If
you don’t know it yet, you’ll have to do a little test.
With most potentiometers, the
wiper is located on the middle pin. But if you have doubts or you want to know
for sure, go get your multimeter and measure the resistance value between the
pins.
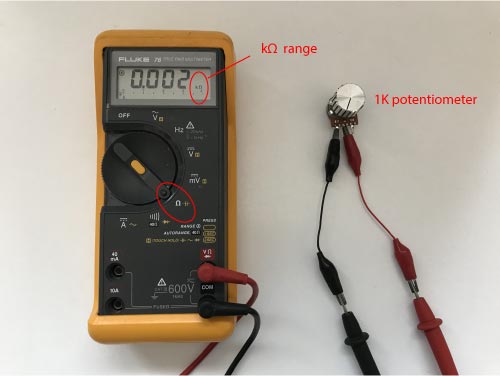
Start by setting the
resistance measurement range on your multimeter. It must be set higher than the
resistance value indicated on the potentiometer (look for the value on the side
or on the back).
If there is no resistance
value to be found anywhere on your potentiometer, don’t worry, just choose a
random resistance range on your multimeter. It is best to choose a small range
to start with.
If you have set the range too
low, the multimeter will indicate an error. To make the error disappear, gradually
switch to a higher range until you can read a resistance value.
Now, turn the knob to
somewhere in the middle of the potentiometer and measure the resistance between
the pins. As there are three pins, you have three possible combinations. Check
them all out.
Your measurement results
should show that one of the measured values is a lot higher than the other two.
The highest measurement value corresponds to the resistance between the two
pins connected to both ends of the potentiometer.
So, now you have found both endpins, the remaining pin is the one connected to the wiper.
Step 2: Find out if the potentiometer’s
total resistance value is still correct
Since you have already measured
the total resistance value of the potentiometer, you just have to compare it
with what is indicated as the resistance value on the side or back of the
potentiometer.
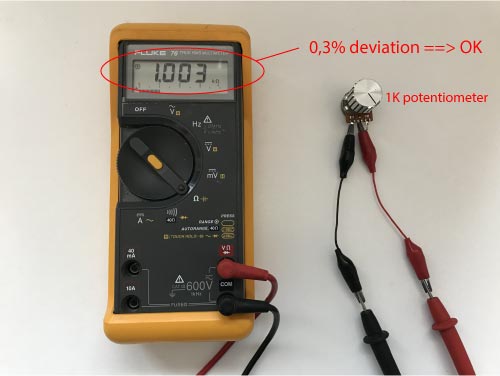
If you don’t find exactly the
same value but something that is close by, don’t panic. Not all potentiometers
are precision components. The tolerance can amount to 10% of the stated value.
But if the measured total
resistance shows a larger deviation, this means that the potentiometer is in a
bad condition and you should throw it away.
Step 3: Find out if the potentiometer’s
resistance path is free from interruptions
The only thing left to do now
is to check whether the resistance path has a smooth gradient.
Therefore, put the probes of your multimeter on one endpin of the potentiometer and the other on the wiper pin.
Now, slowly turn the wiper
from one end to the other end and keep your eye on the multimeter display.
You should see the resistance
value increase or decrease smoothly without large jumps up or down.
Be aware that there are also
logarithmic potentiometers. So, if you think that the resistance value is
increasing or decreasing too fast compared to the speed of rotation of the
wiper, you could be testing an audio potentiometer with a logarithmic taper.
Which potentiometer types exist?
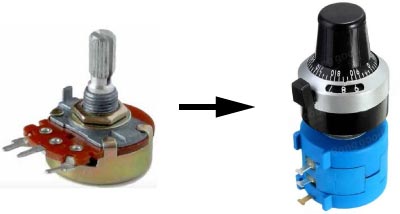
Rotary potentiometer
single turn rotary potentiometer Photo by lainf / CC BY-SA 3.0
There are two design variations for a rotary potentiometer: single-turn and multi-turn. The most widely used industrial potentiometers are single-turn rotary potentiometers.
To move along the entire resistance range, single-turn potentiometers need to rotate less than 360°, while multi-turn potentiometers need to make multiple revolutions (e.g. 5, 10, 20, or 25 turns).
Due to their longer resistance path, multi-turn potentiometers have a higher resolution than single-turn potentiometers and are therefore much more accurate. The more complex design, however, also ensures that multi-turn potentiometers are more expensive.
Slide potentiometer
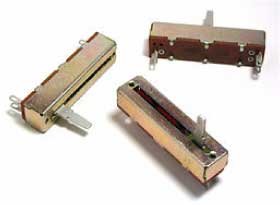
slide potentiometer Photo by Omegatron / CC BY-SA 3.0
Unlike the rotary potentiometer, where the wiper performs a circular motion, the wiper of a slide potentiometer moves along a rectangular strip of resistance material in a straight line.
Because this potentiometer requires a large longitudinal opening for passage of the slider, there is a greater risk of dust and moisture getting caught between the sliding contacts and the resistance element. This causes more noise and even an interruption of the output signal.
Brushes or overlapping plastic foils covering that large opening can prevent dust from getting into the potentiometer but the risk is never excluded.
What materials are potentiometers made of?
Wirewound potentiometer
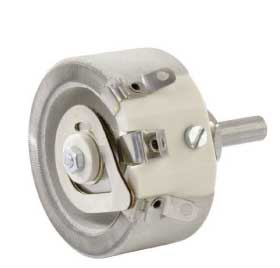
wirewound potentiometer
A wirewound potentiometer is made by wrapping a resistance wire, usually nickel chrome, around a ceramic, plastic, or glass fiber core. Both ends of the resistance wire are attached to the terminals.
Usually, nickel-chromium is used as the resistance wire because this material has a very low temperature coefficient of resistance, which leads to a more stable potentiometer. The coil is usually enclosed by a ceramic layer that only leaves the wiper’s path uncovered so that it can make contact with the resistance element.
Carbon film potentiometer
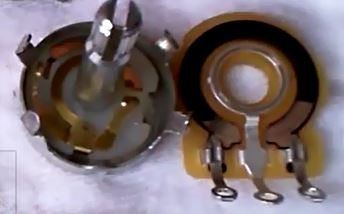
carbon film potentiometer
A carbon film potentiometer consists of a thin layer of carbon composite ink, molded on a phenolic resin base. The production process is quick and easy and therefore these potentiometers are quite cheap.
Cermet potentiometer
Cermet (CERamicMETal) potentiometers have a resistance element that consists of a mixture of metal particles and ceramics. Usually, the mixture contains less than 20% metal. The most commonly used metals are nickel, molybdenum, and cobalt.
Plastic film potentiometer
The plastic film is sometimes also referred to as conductive plastic. The resistance element is composed of plastic resin such as epoxy, polyesters, improved phenolics, or polyamides to which carbon powder is added. The carbon grain size of about 0.01 μm determines the potentiometer resolution. The mixture is applied in a thick layer to a ceramic or plastic substrate using screen-printing methods and is then hardened in an oven.
How can a potentiometer be made more sensitive?
To answer this question, I must first explain the concept of a potential gradient.
If you connect a potentiometer
to a voltage source, there will be a voltage V across its total resistance
between pins 1 and 3.
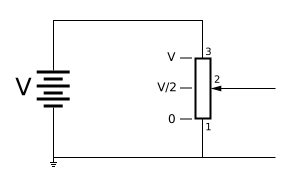
If pin 1 is connected to ground, the potential at pin 1 will be zero volts, while the potential at pin 3 will be equal to the potential V of the voltage source.
Halfway the linear resistance
path, the potential will be half the potential of the voltage source, i.e. V/2.
So you see that the potential
is gradually increasing over the full length of the resistance path, just like
a gradient.
The potential gradient is the rate of change of potential with respect to distance.
This means that:
The
potential gradient is constant for a given potentiometer connected to a fixed
potential.
Let’s
put some numbers in that formula.
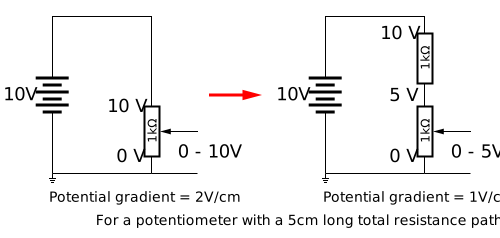
Say
that the potential across the resistance path is 10V and that its length is 5
cm. The potential gradient then amounts to 2 V/cm.
This
means that the output of the potentiometer increases by 2 V when we move the
wiper 1 cm along the resistance path.
To obtain a potentiometer that is more sensitive, we need to reduce the potential gradient so that the change in output is smaller for the same wiper movement.
This
way we can vary the output voltage in smaller steps.
How can we reduce the potential gradient?
Well,
looking at the formula, there are two ways to do that.
We can increase the length of the resistance path.
We can decrease the potential across the total resistance path of the potentiometer.
Increasing the length of the resistance path cannot be done with a given potentiometer. So, if we want to follow this method, we will have to swap the potentiometer for another one with a longer resistance path, like e.g. a multiturn potentiometer.
Decreasing
the potential across the total resistance path can be done with a given
potentiometer by putting a resistor in series with the potentiometer as shown
in the drawing below.
Depending
on the resistance value of the added resistor, the potential gradient will be
reduced to a greater or lesser extent. In the example shown, the potential
gradient will be halved by choosing a resistor with the same resistance value
as the potentiometer.
Can a potentiometer be repaired?
Due
to the many devices nowadays using a digital volume control, many people are no
longer used to hearing the sound of a scratchy potentiometer. If you are one of them, do not think that you are missing out on something, it
is just terrible.
Looking
at what causes a potentiometer to be scratchy, we can list a number of reasons.
First
of all, there is the problem of dust entering the potentiometer. Especially slider
potentiometers are prone to dust because it is more difficult to seal the large
longitudinal opening for passage of the slider. Dust can cause the wiper to
lose contact with the resistive element, thereby interrupting the output signal.
Secondly, oxidation on the wiper and the sliding track due to moist air will increase the contact resistance between the wiper, the resistive element, and the sliding track, thereby weakening the output signal.
And third, traces of wear on the resistive element due to contact with the wiper causes the resistance value to fluctuate during the wiper movement.
So,
what can be done about it?
To begin with, you must always try to first remove
the dust and corrosion from the potentiometer. You can try to do this without
having to disassemble it.
Warning!
Before starting the repair, you must unplug the device from the mains and remove all batteries (if present). Failure to comply with this precaution could result in serious injury or property damage.
Look
for small openings on the side or around the connection pins. Along these
openings, you can blow out any dust with compressed air. Then you spray some
contact cleaning fluid through the same openings. Try to aim in all possible
directions to make sure the internals are all wetted.
Contact cleaner is a chemical product based on solvents. It dries quickly, leaves no residue, and removes all oil, dirt, condensation, and encrustations caused by oxidation.
Wait
for a few minutes to be sure that the solvents are evaporated and then put the
power supply back on.
You
can now test your potentiometer and see if your efforts have been rewarded.
If
the problem is not yet resolved, the oxidation may be more severe than expected
or there may be wear on the resistive element. The only solution to that is
opening up the potentiometer.
Don’t
forget to switch the power supply back off and take the batteries out before
dismantling anything.
With
the potentiometer open, check the sliding track and the contact points of the
wiper for oxidation. If you see any oxidation, you can use a piece of very fine
sandpaper (P1000 or higher) to sand it off.
Repairing the wear tracks on the resistive element caused by the wiper is nearly impossible without ruining the potentiometer. But what you could do is bend the fingers of the wiper a little bit inward or outward so they run on a fresh track of the resistive element. Be careful though not to break them off.
Before
you reassemble the potentiometer make sure there is no dust left behind on the
inside.
One
last remark. If you would happen to have a completely sealed potentiometer, you
cannot do anything of the above at all. In this case, you’ll have to replace
the unit.
Level is one of the four most measured parameters in the industry.
Many different types of level measurement instruments are on the market. The right choice for your application is not easy and often depends on understanding the different level measurement techniques and knowing which process conditions are affecting the performance of the level sensor.
While most level sensing technologies are capable of functioning well at many different process conditions, there is no single level transmitter good for all applications.
But:
Once you understand the working principle of all these different technologies, your task will become a lot more simple.
And in today’s post, I will briefly describe the working principle of 17 different level measurement instruments.
At the bottom of the article, you will also find a table that shows which technology is suitable for specific process conditions.
1. Sight glass level gauge
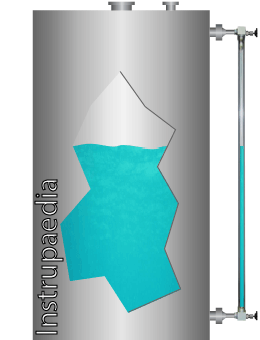
A sight glass is the simplest device for measuring the liquid level in a vessel.
It is nothing more than a transparent glass tube, installed on the outside of a vessel, and connected to the bottom and the top of the vessel.
Sight glasses use the law of communicating vessels to indicate the level on the graduated gauge board.
The height of the liquid column in the sight glass will always be the same as the one inside the vessel.
Sometimes there are no graduations at all, and the sight glass is just showing the height of the liquid in the vessel.
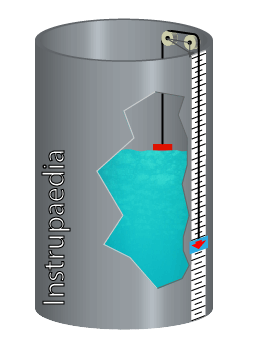
2. Float level gauge
This old technique was the first attempt to automate the measurement of level in tanks after previously the level was measured manually by means of a rope with a float attached to it.
A float level gauge has a float hanging from a rope inside the tank. The rope is passed over two pulleys to a counterweight on the outside of the tank. The counterweight itself serves as an indicator on a direct reading gauge board.
Float level gauges operate on the principle of buoyancy, which means that a material with a lower density floats on a material with a higher density.
The float level indicator shown on the drawing is not the only existing type.
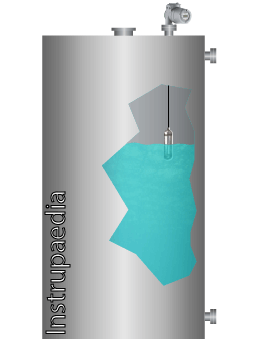
3. Displacer level transmitter principle
A displacer level transmitter is intended for liquid applications.
The displacer rod is immersed in the liquid and hanging on a spring or a torque tube. It always has a higher density than the liquid, so it doesn’t float.
When the vessel is completely filled and thus the displacer rod is fully immersed, there will still be a downward force on the spring.
The operation of a displacer level transmitter is based on Archimedes’ principle that states that the upward buoyant force that is exerted on a body immersed in a fluid, whether fully or partially submerged, is equal to the weight of the displaced fluid.
In this case, the buoyant force is acting on the displacer rod, pushing it upwards.
When the liquid level rises, the buoyant force will increase, reducing the apparent weight of the displacer rod. This reduces the length of the spring while the displacer moves upwards.
The up and down movement of the displacer rod is measured by sensors in the head of the transmitter and converted into an output signal.
4. Servo level transmitter principle
A small displacer hangs on a cable that is rolled up on a wire drum. The wire drum is magnetically coupled with a weight balance and is driven by a bi-directional servo motor.
When the displacer is lowered into the vessel and reaches the liquid surface, its apparent weight will decrease under the influence of the buoyant force.
The weight loss is detected by the weighing balance which then sends a signal to the control unit to stop the servo motor.
The length of the unwound cable is calculated by counting the number of revolutions of the wire drum by means of a set of Hall effect sensors and multiplying it by the known circumference of the drum.
Subtracting the result of this calculation from the total height of the vessel gives the height of the liquid in the tank.
When the level changes, the weighing balance will reposition the displacer until a new equilibrium is reached.
The servo level gauge is based on Archimedes’ principle as it uses the buoyant force during the measurement, and can therefore only be used for liquid level measurements.
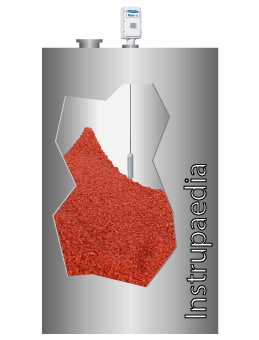
5. Weight and cable level transmitter principle
The operation of electromechanical level transmitters, as they are sometimes called, is very similar to servo level transmitters.
The difference is mainly in the control of the probe and the internally used sensors.
Although the technique is used primarily for solids, also liquid levels can be measured by replacing the weight with a floating probe.
A weight is lowered through the roof of the tank until it reaches the surface of the product.
As soon as the probe touches the surface, the cable will become slack, and the unwinding of the cable will be stopped. The probe is then pulled back upwards.
The length of the unwound cable is measured both during the downward and upward movements, and the results are compared with each other. If there is a difference between the two measurement values, a new measurement starts.
The electronics convert the information about the measured length into an output signal that corresponds to the level or volume/weight in the tank.
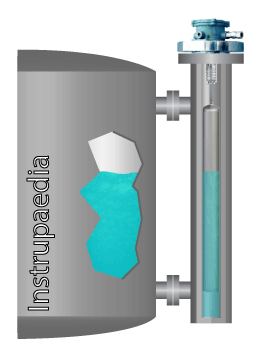
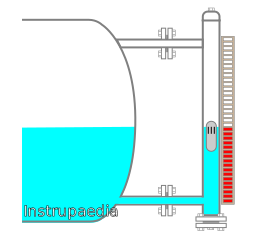
6. Magnetic level gauge principle
Magnetic level gauges are based on the law of magnetism.
Just like sight glasses, they are side-mounted to a tank and connected with valves to the bottom and top of the tank.
A magnetic level gauge consists of two main parts:
A vertical pipe (also called ‘the chamber’), containing the process fluid and a float equipped with a magnet.
A transparent enclosure mounted to the chamber with a number of indicators (flags) that are magnetically coupled to the float.
The float inside the chamber moves up and down with the surface of the liquid as it rises and falls.
Each time the float passes by a flag, their magnetic fields are coupled.
The magnetic coupling causes the flag to rotate around its axis, making the rear of the flag visible.
The liquid level becomes clearly indicated because the rear of the flag has a different color than the front.
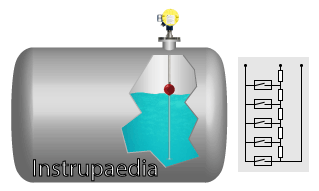
7. Resistive chain principle
A resistive chain level sensor is based on the float principle and works in an almost similar way as a magnetic level gauge.
The sensor has a float, with an embedded permanent magnet, which slides along a vertical guide tube.
The tube has a built-in 3-wire potentiometer consisting of several individual resistors in series, each with its own reed contact.
When the float moves up and down, its magnetic field will close the reed contact located at the level of the float.
The closed reed contact thus becomes the tapping point on the potentiometer that divides its total resistance into 2 parts.
One part is used as the measured value, which is proportional to the level of the liquid and can be sent directly as a resistance value or converted to a current signal.
The finely stepped resistance chain makes the measurement virtually continuous.
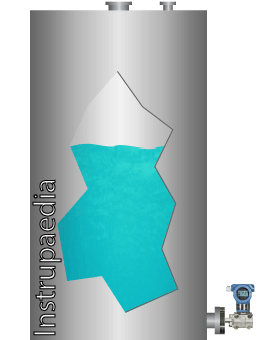
8. Hydrostatic level measurement principle
Hydrostatic level sensors are using the principle of hydrostatic pressure in a liquid column to measure the height of the level in a tank.
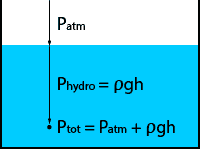
These sensors are actually pressure sensors that measure the hydrostatic pressure at a certain depth in the liquid, and then use the formula Phydro = ρgh to calculate the filling height (h) of the tank
As you can see from the formula, density (ρ) and gravity (g) are important factors in the determination of the level.
Any change in their value will have an influence on the accuracy of the measurement.
Hydrostatic level transmitters are used for level measurement in open or vented vessels where the gas phase on top of the liquid is at ambient pressure, and for sealed or gas-tight vessels where the pressure above the liquid is variable.
The sensors are equipped with a relative pressure measuring cell of which one side is exposed to the hydrostatic pressure and the other side is connected to:
the ambient pressure, in the case of open vessels,
the variable pressure on top of the liquid, in the case of sealed vessels.
In this way, the pressure acting on the liquid surface is automatically compensated.
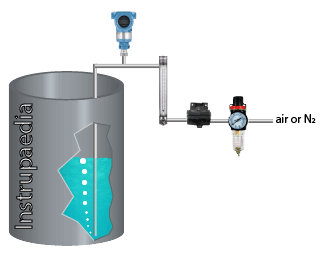
9. Bubble tube principle
Bubbler tube level measurement is based on the hydrostatic pressure principle.
The bubbler is composed of:
A dip tube
A pressure transmitter
A flow restrictor
A source of compressed gas
The dip tube is inserted into the liquid and runs up to a few centimeters from the bottom of the tank.
Air or dry nitrogen is used as a source of compressed gas and connected to the other end of the tube.
The gas pressure is reduced by a flow restrictor, which could be a needle valve or a V-notch ball valve.
With the liquid level up to 100%, the gas flow can be adjusted so that only a small number of bubbles per minute flow out of the tube.
As the gas flows through the tube, the pressure inside the tube will rise until it equals the hydrostatic pressure of the liquid at the open end of the tube.
This hydrostatic pressure is measured by the pressure transmitter connected to the tube.
When the density of the liquid is known, the transmitter can now calculate the level using the formula Phydro = ρgh
10. Capacitive level sensor principle
The operation of a capacitance level transmitter is comparable to that of a variable capacitor.
The metal probe of the sensor serves as the one plate of the capacitor while the metal tank wall represents the other plate.
The liquid inside the tank acts as the dielectric material between the two plates.
When the liquid level rises, the capacity will increase. The value of this capacity is a measure for the height of the liquid in the tank.
If the liquid is non-conductive, the capacitor is formed between the metal probe and the metal tank wall.
If the liquid is conductive, the metal probe is insulated and the insulation serves as the dielectric material.
When the vessel is made of non-conductive material, the capacitive level sensor needs a reference probe that serves as the second plate of the capacitor.
11. Ultrasonic level transmitter principle
The principle of an ultrasonic sensor is based on the time of flight (TOF) of an ultrasound pulse that moves back and forth between the sensor and the surface of the medium.
The sensor emits a high-frequency pulse in the range of 10 to 70 kHz, directed towards the surface of the medium.
When this pulse hits the surface, it bounces back to the sensor.
This reflected signal is also called ‘the echo’.
From the moment the echo arrives at the sensor, the transmitter calculates the distance to the surface using the formula:
With this information, the transmitter can now determine the level inside the vessel by subtracting the distance to the surface from the total height of the vessel.
An ultrasonic level transmitter is, in fact, nothing more than a high-tech timer with several features to be able to emit and receive ultrasound waves.
This technique can be used for both liquids and solids.
12. Magnetostrictive principle
The principle that has been adopted for this measurement technique is called the Wiedemann effect.
This is one of the four effects that are related to magnetostriction, which is a property of ferromagnetic materials.
A magnetostrictive level sensor consists of a float that slides along a vertical ferromagnetic rod (also called the waveguide) during the rise and fall of the level. A permanent magnet is located inside the float at a precise location that corresponds to the level of the liquid.
If the exact position of this magnet could be measured, then the level of the liquid could be calculated.
So, how is this done:
At the start of the measurement, the transmitter sends a short current pulse down the waveguide and starts a timer from the moment the pulse leaves the transmitter.
As the current pulse is flowing through the waveguide, it creates a small circular magnetic field around the rod.
When the pulse arrives at the float, its circular magnetic field will intersect with the magnetic field of the permanent magnet.
The interaction between the two magnetic fields causes a mechanical torsional force in the waveguide as if the rod is locally twisted.
This torsional force is propagated along the waveguide as an acoustic torsional wave and flows back to the transmitter at a constant speed close to the speed of sound.
At the top of the waveguide, a pick-up coil or a piezo crystal will detect the torsional wave and convert it into a corresponding electrical signal.
At the same time, the timer is stopped and the time delay from the excitation of the waveguide to the reception of the corresponding acoustic wave is calculated.
From this time delay, knowing that the acoustic wave traveled at a constant speed, we can now calculate the position of the float.
The system for the time interval measurement is similar to the time of flight principle in ultrasonic level sensors.
13. Non-contact radar principle
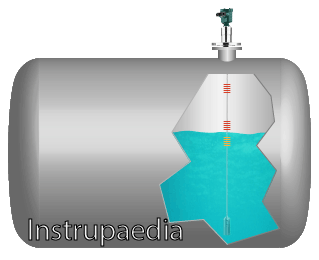
Frequency modulated continuous wave (FMCW) and pulsed time-of-flight (ToF or PToF) are the two technologies used in modern radar-based level measurements.
Both of them are non-contact measurements, which means that the instrument is not touching the product inside the tank.
Pulsed time-of-flight is the oldest of both methods, which does not mean that it is less good than FMCW radar.
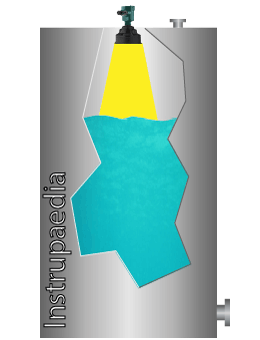
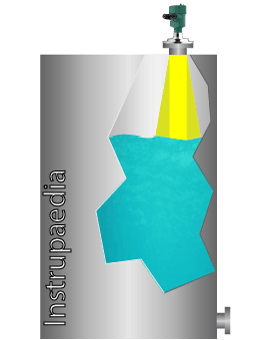
Pulsed radar systems use their antenna to emit a high-frequency electromagnetic wave (called ‘the pulse’) during a very short period of time.
The pulse travels with the speed of light directly towards the surface of the process medium and reflects from the medium surface due to a change in the dielectric constant.
The reflected pulse travels back to the transmitter which, on arrival, measures the time delay between the emitted and the received pulse.
It’s this time delay that is called ‘time of flight’.
The transmitter’s microprocessor then calculates the distance to the medium surface using the formula:
Since the height of the tank has already been programmed in the transmitter, the level can now be found by subtracting this distance from the tank height.
An FMCW radar works a little bit differently.
It differs in the way that the radar sends out and receives a continuous wave and instead of measuring the delay time, it measures the difference in frequency between the emitted and the received signal.
The radar’s oscillator transmits a linear frequency sweep at a fixed bandwidth and sweep time.
Simply said:
The emitted frequency runs up and down between two fixed values in a straight pattern like a triangle, during a fixed period of time.
When the electromagnetic wave hits the surface, it bounces back to the sensor.
The incoming reflection is received by the antenna and sent to a mixer to be compared with the signal that is being transmitted at that time.
The difference in frequency between the emitted and received signal is proportional to the time of flight, and to the distance to the medium surface.
Once the onboard microprocessor has calculated the distance to the surface, it becomes easy to find the level of the medium because the tank height is already programmed.
Non-contact radar level instruments may be equipped with various types of antennas and may operate at different frequencies.
14. Guided wave radar principle
Guided wave radar (GWR) is the latest invention, although already several years on the market, in radar level measurement technique and has its roots in the time domain reflectometry (TDR).
The TDR technology has been developed originally for detecting fractures in underground cables and more specifically for measuring the distance to the fracture.
GWR level transmitters are now using this method to measure the distance to the surface of the liquid (or solid, bulk product).
How it works:
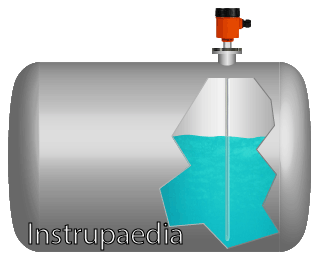
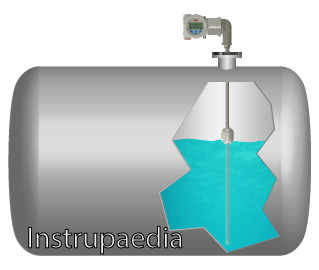
The instrument’s antenna has the shape of a probe (the waveguide) and is immersed in the process medium. Its length determines the range of the measurement.
A high-frequency electromagnetic pulse is launched from the radar transmitter onto the waveguide towards the surface of the measured product.
The waves are staying close to the waveguide as they follow the probe towards the surface.
When the pulse hits the surface of the product, a significant part is reflected back up the probe while the other part penetrates the product.
The transmitter receives the reflected wave and calculates the time delay between the generated and reflected pulse.
The result of this calculation then serves to calculate the distance to the surface.
15. Laser level transmitter principle
Distance measurement using lasers is done with one of the following techniques:
Pulsed lasers
Frequency modulated continuous wave lasers
Triangulation lasers
Although it is perfectly possible to measure level with all three techniques, only pulsed lasers are used for industrial applications.
This is because they are better suited to penetrate dust and steam.
Continuous-wave and triangulation lasers are more into short-range measurements, whereby continuous-wave lasers are used in highly accurate laboratory equipment and triangulation lasers are used in positioning applications and robotics.
So, since we are only talking about industrial laser level measurements, I will only explain the pulsed laser technology.
The principle of a pulsed laser level transmitter is again based on the time-of-flight technique.
The laser diode sends out a light pulse with a very sharp beam angle of less than 0,3°.
The reflection that comes off the surface of the process medium is captured by the receiver.
A very precise timing circuit measures the time delay between the transmitted and received pulse and sends the result to the microprocessor which calculates the distance to the surface using the formula:
Once this distance is known, the level can be found by making the difference between the height of the tank and the distance to the surface.
16. Load cell principle
A load cell is a force transducer for measuring weight. Its output signal is proportional to the weight being measured.
Tanks and silos can be mounted on one or multiple load cells so that their entire weight can be measured.
There are mainly three different technologies that can be categorized:
Hydraulic
Pneumatic
Electronic
Hydraulic and pneumatic load cells use precision bourdon tubes or pressure transducers to give an indication of the weight while electronic load cells use various techniques to convert force into electrical signals.
The electronic load cell, more specifically the strain gauge load cell, is by far the most used type.
In order to determine the level, the weighing system must first be tared with an empty tank so that only the net content of the tank is measured.
The filling level is then determined by evaluating the measurement data.
The conversion to fill level can only take place if the density of the product is constant.
The calculation uses a strapping table in which weight and level are paired in steps.
When the measured weight is between two steps, the level is determined by interpolation.
17. Nuclear level measurement principle
It may look a bit strange at first sight to use nuclear energy to measure something as simple as a product level in a vessel.
But sometimes there is no other choice.
How else would you measure the level of a product which enters the tank tangentially, with high velocity, creating a huge vortex inside the tank?
Usually, these kinds of applications have a vacuum on top of the fluid and are subject to vibrations.
Your options may be limited to just detecting the minimum and maximum level or measuring the level with a nuclear level transmitter.
In our example application, measuring this large vortex actually means determining an average level.
So, how can we measure the level with a nuclear source?
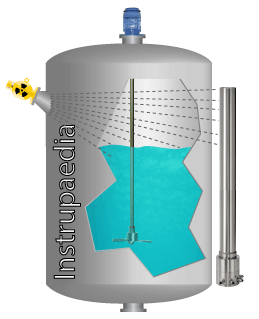
A nuclear level transmitter is composed of two main components:
The radioactive source
The radiation detector
Both components are mounted on the outside of the tank, right in front of each other on opposite sides of the tank.
The source is made of a radioactive substance, either cesium 137 or cobalt 60, and is constantly emitting gamma rays, straight through the vessel walls, in the direction of the radiation detector.
When the tank is empty, a lot of radiation will reach the detector. But when the level rises, the liquid or solid product will attenuate the radiation that reaches the detector.
Modern detectors use scintillation technology to convert the gamma radiation into a proportional amount of light which is then sensed by a photomultiplier and converted into an electrical signal.
Which technology solves your problem?
The table below lists a number of frequently occurring process conditions that may, to a greater or lesser extent, pose a problem to level measurement.
Depending on the operating principle on which the level measurement is based, this problem will be large, medium, or non-existent.
This table should give you a general idea of which technology to choose for your application.
Table legend
Good – This technology has little to no problem with this condition
Moderate – Performance can be worse unless special measures are taken
Poor – This condition is problematic or impossible to handle
This technology is not suitable for level measurement of solids
Process conditions
Glass level gauges
Floats
Displacer
Servo
Cable & weight
Magnetic level gauges
Resistive chain
Hydrostatic
Air bubbler
Capacitance
Ultrasonic
Magnetostrictive
Non-contact radar pulse
Non-contact radar FMCW
Guided wave radar
Laser
Load cells
Nuclear (gamma)
Light foam
Dense foam
Surface turbulence
4
2
2
2
2
2
2
2
2
Agitation
2
2
Low vessel pressure (vacuum)
7
High vessel pressure
7
6
High process temperature
6
Product density changes
1
1
1
1
1
1
1
1
1
1
Product dielectric changes
5
5
5
Obstructions inside vessel
4
Slurries
Viscous, sticky product
Product coating
3
Corrosive product
Vapors
Solids
Dust
CIP (Cleaning In Place)
6
Only small density changes, otherwise too much accuracy loss
Too much turbulence will result in unstable measurement
Product coating on the vessel wall will influence the measurement result
When installed in a stilling well
Dielectric changes will influence the accuracy of interface measurement
With glass window to isolate the transmitter from the process
Use DP-cell when headspace is not at atmospheric pressure
In the early days of thermometry, there was a lot of doubt about what thermometer liquid to use. Should they have used alcohol or was it better to use mercury?
Both liquids have their set of advantages.
Let’s list them up.
Alcohol thermometers
Advantages of alcohol (ethanol):
It has a very large thermal expansion coefficient.
Unharmful to humans and the environment (at least if you don’t drink it!).
A low freezing point (-115°C) makes it possible to measure very low temperatures.
It’s a bit cheaper than mercury.
Disadvantages of alcohol (ethanol):
Impossible to measure high temperatures because of the low boiling point of alcohol.
It has a nonlinear expansion coefficient which leads to a small measurement error.
Quick reaction to changes in temperature because metal is a good heat conductor.
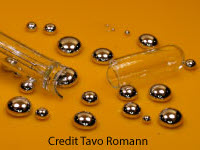
Mercury has a very low saturation vapor pressure.
Possible to measure higher temperatures as in cooking.
Same expansion coefficient at all temperatures.
The shiny silver color is easy to see.
Disadvantages of mercury:
Mercury is toxic, especially in a gaseous state.
It’s a bit more expensive than alcohol.
Low thermal expansion coefficient.
I guess the advantage of a very low saturation vapor pressure of mercury needs a little more explanation.
So, if we consider a perfect thermometer, the volume above the liquid should be a vacuum.
In reality, however, this isn’t the case. There will be always a small number of gas molecules present in the volume above the liquid.
Since ethanol evaporates faster than mercury, more gas molecules will be present in that volume.
This results in a pressure build-up above the liquid surface and a faulty indication of the thermometer.
CONCLUSION:
Whether the best thermometer liquid is alcohol or mercury depends on the application.
When the thermometer is used to measure the outside temperature, alcohol will do fine.
The readout will be sufficiently accurate, even with a nonlinear expansion coefficient, and it will still work at very cold temperatures.
If the purpose of the thermometer is to use it during the preparation of food, mercury could be used because of its high boiling point (356,7°C).
If alcohol was used for this application, it would start to boil at around 78°C. The vapor pressure would rise quickly inside the capillary and in the end, the bulb will break and spoil your dinner.
Important to know however is the fact that mercury is toxic and the use of mercury-in-glass thermometers is forbidden in many countries, except for industrial and scientific applications.
For reasons of toxicity alone, I would not recommend using mercury in food preparation. Glass thermometers can easily break. A better choice would be to use a digital thermometer.
Mercury is perhaps the best thermometric fluid, but due to its poisonous property, it is now increasingly being banned from laboratories and industry in favor of alternative methods.
These alternatives include:
Resistance Temperature Detector (RTD) (-200 / +850°C)
8 unique temperature scales you may or may not know
Origin of temperature units
We all use temperature scales every day, whether it’s just to know the outside temperature or to adjust the temperature in our room.
Dealing with temperature is so obvious that we no longer think about it.
But did you know that there were once 8 different, popular temperature scales to choose from?
And there were even more than 30 if you also count the less popular ones.
Fortunately, we don’t have to use all of them. Some are not in use anymore and others are only used for specific applications.
You could wonder why we have all these different temperature scales. Wouldn’t it be much easier to have only one?
Well, not really. There are different temperature scales for a reason. I tell you why at the end of the article.
Let’s first have a look at these 8 temperature scales.
The Newton scale (1701)
You must surely know Sir Isaac Newton (°1643 – †1727) or at least heard about him before.
There is a very famous story about him saying that he discovered his theory of gravitation when he sat down under an apple tree and an apple fell on his head.
If this is completely true, I don’t know, but he certainly discovered gravity and much more than that.
Newton was an English mathematician, astronomer, theologian, author, and physicist. One of the greatest scientists ever, comparable to Einstein, with discoveries like the color spectrum (using a glass prism) and the three laws of motion.
Next, to all these areas of interest, he was the first to develop a temperature scale in 1701.
With his thermometer made of a thick glass tube, 1.5 to 2 inches in diameter, and filled with linseed oil, he measured the temperature of melting snow. This temperature became his first defined point on the temperature scale. So he has assigned it the number 0.
The second defined temperature point on the Newton scale was body heat which he described as ‘the external heat of the body in its natural state’. He defined this temperature as 12 degrees of heat.
Yes, Newton didn’t speak about temperature, although he called his instrument a thermometer, he called it degrees of heat.
So now that he had calibrated his thermometer, he could start measuring temperatures, but only in the lower range because linseed oil reaches its boiling point at about 287°C (depending on the purity). Secondly, the oil starts to decompose around its boiling point which would change its coefficient of expansion, making the thermometer useless.
While his linseed thermometer would also be able to measure small negative temperatures, Newton never explored this side of the temperature scale. So the initial Newton scale had no negative numbers.
Newton didn’t have the intention to invent the thermometer for everyday use. As he was appointed Warden of the Royal Mint, a company that produced coins for the United Kingdom, he was more interested in determining the boiling points of metals.
To calibrate his thermometer for temperatures above body heat, he heated a ‘pretty thick piece of iron’ to the point where it became red hot.
He described the temperature of red hot iron as ‘the degree of heat of live coals in a small kitchen fire, made up of bituminous pit coals, and that burn without using bellows’.
Not a very accurate description of a temperature if you ask me, but that didn’t really matter because his intention was to calculate that temperature using his law of cooling and the already, for low temperatures, calibrated thermometer.
So, to do that, he placed small pieces of different metals on his red hot iron slab. These metals were fusible alloys of tin, lead, and bismuth, which melted fairly quickly by the heat of the iron block.
As the iron cooled down, the alloys solidified one by one at their own specific temperature.
Newton recorded the time when the iron block started to cool and also the times at which the different alloys solidified. Finally, he also noted the time when the iron had cooled down so much that its temperature could be measured directly with the linseed oil thermometer. This means that it had to cool down to body temperature.
Now he could apply the law of cooling to calculate the temperatures at which the alloys had solidified and the temperature of the iron at the start of the experiment.
He found 7 new defined points on his temperature scale:
40°N:
melting point of an alloy of one part lead, four parts tin and five parts bismuth
48°N:
melting point of an alloy of equal parts of bismuth and tin
57°N:
melting point of an alloy of one part bismuth and two parts tin
68°N:
melting point of an alloy of one part bismuth and eight parts tin
81°N:
melting point of bismuth
96°N:
melting point of lead
192°N:
heat of iron glowing as brightly as possible
If you have never heard of the Newton temperature scale, no problem, it is no longer used.
Convert Degrees Newton to
Rømer
Fahrenheit
Réaumur
Delisle
Celsius
Kelvin
Rankine
The Rømer scale (1701)
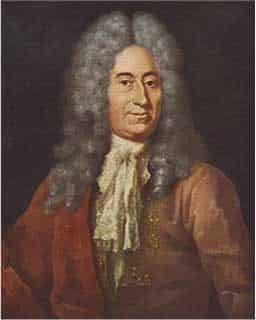
Ole Christensen Rømer (°1644 – †1710) was a Danish astronomer who studied in Copenhagen (Denmark) and later went to work in Paris.
He also worked closely with astronomers such as Gottfried Leibniz, Christiaan Huygens, and Isaac Newton.
In 1676 he was the first to calculate the speed of light by making use of his observations of the eclipses of Io, a moon of Jupiter.
He found that light travels at a speed of 225.000 km/s.
Well, not all that accurate, since we now know it is 299.792,458 km/s (in a vacuum).
When he returned from Paris, in 1681, he became a professor of astronomy at the University of Copenhagen and was appointed as director of the Roundtower Observatory a few years later.
In his own house, he had constructed his transit instrument, which he used to measure the position of stars, but the instrument was affected by the refraction of light and the changes in temperature.
To compensate for variations in temperature, he needed a thermometer.
Not an easy task to find a good thermometer at the time. Even if you found one, it had no temperature scale. Let alone that it could be used for scientific purposes.
So he decided to create one on his own and started to do some experiments with a glass tube filled with ‘spiritus vini colored with saffron’.
Yes, that means he used wine as a thermometer liquid.
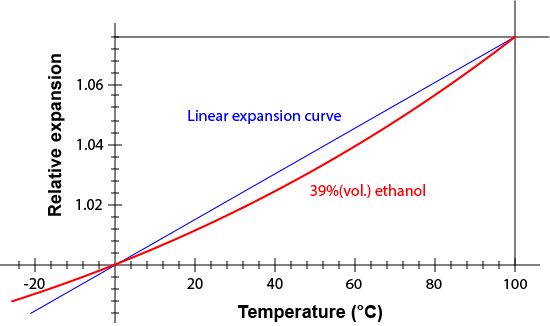
This had some advantages. As wine is largely a mixture of water and alcohol, it had a more linear dilatation curve than pure water. Remember that water has a little odd behavior around 4°C.
From calculations, it could later be found that the mixture contained 39% alcohol by volume.
Wow, they had strong wine back then. No wonder his calculation of light speed was a little off.
At this point, he had the glass tube and the fluid to put in.
Now, how did he calibrate his thermometer?
Well, when he realized that the air pressure above the liquid would have an influence on the height of the liquid column, he sealed the glass tube at the top.
Then he immersed the bulb of his thermometer in ice water and put a mark on the glass tube at the top of the liquid column.
After that, he submerged the bulb in boiling water and made another mark on the tube.
So now his thermometer was calibrated. The only thing left was to put numbers on the scale.
He didn’t want negative numbers because this would be too confusing and people would perhaps forget to put the minus sign in front of the number when writing down temperatures.
In order to avoid this, he divided his scale into 7 equal parts and also placed 1 equal part below the mark of the freezing point of water, so that the scale consisted of 8 equal parts in total.
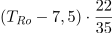
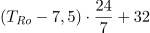
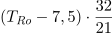
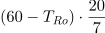
He wrote the number 0 at the bottom of the scale and 60 at the top. Between these two marks, he made a linear distribution of degrees. According to this scale, the freezing point of water was at 7,5°Ro.
The fact that he chose the number 60 for the boiling point of water was not all that strange.
Being an astronomer he was used to using the sexagesimal (base 60) numeral system for performing calculations and measuring time, angles, and geographic coordinates.
This was the first thermometer that could be calibrated over and over again with high precision as the boiling and freezing points of water are easy to reproduce.
Nevertheless, as the years went by, better solutions emerged and the Romer temperature scale became out of use.
Convert Degrees Rømer to
Newton
Fahrenheit
Réaumur
Delisle
Celsius
Kelvin
Rankine
The Fahrenheit scale (1724)
Daniel Gabriel Fahrenheit (°1686 – †1736) was born in Danzig (now Gdansk – Poland) as a child of prosperous parents.
He would have studied medicine if not both his parents had suddenly died from mushroom poisoning when he was 15 years old.
The foster parents, where he and his two brothers and two sisters were housed, were not in favor of university studies and sent him to Amsterdam (The Netherlands) for a bookkeeping course.
Fahrenheit, however, was more interested in instruments than bookkeeping. So it was not long after his studies that he started making his own thermometers, the old-fashioned way with divisions in the same way as Florentine thermometers:
The upper limit of 90° for ‘extreme heat’
0° for ‘moderate heat’
The lower limit of 90° for ‘extreme cold’
In 1708 he went to Denmark to visit Rømer. It turned out to be a momentous encounter that had a major impact on his later work.
He learned from Rømer that good, consistent thermometers were in considerable demand for scientific work. But they needed to be identical to each other so that the measurements could be compared.
From then on he was convinced that a thermometer needed an accurate temperature scale and that this scale had to be reproducible.
He took the idea of a temperature scale from Rømer but did not like the decimals on the scale, e.g. 7,5° for freezing water and 22,5° for body heat.
So he rounded them up to 8 and 24, thereby using the freezing point of water and body heat as calibration points.
It is this scale that is, in fact, the original Fahrenheit scale. He changed it a couple of times later on for various reasons.
The exact moment at which he made these changes is not entirely clear because Fahrenheit did not keep notes of his experiments. All information we have comes from letters he wrote to fellow scientists.
At some point in time, it must have been around 1713, he multiplied all the numbers on his scale by 4, giving the scale a range of 96°F with the freezing point of water at 32°F.
This allowed the scale to be read more accurately because there were finer subdivisions that came in handy when using his thermometers for scientific purposes.
Another reason could have been that the 64° between his two calibration points (96° and 32°) is much easier to devise in equal parts, as 64 is the eighth power of 2.
So by consecutive divisions by 2 of each scale section, he could easily put the marks on his scale.
Some say that he used brine, a mixture of salt and water, which he cooled down to its freezing point and used this as the calibration point for 0°F.
But this can not be proven and is highly doubtful as different mixtures have been found in the literature and none of them freezes at exactly 0°F.
It is more likely that he used the brine as a checkpoint for his thermometer but calibrated it with freezing water.
Fahrenheit used alcohol as a thermometric liquid but was actually not satisfied with it because alcohol with exact same composition was difficult to obtain and therefore the expansion coefficient was always different.
Secondly, the boiling point of alcohol is low, so it’s impossible to measure high temperatures.
To overcome this problem he started new experiments with different thermometric liquids to finally discover that mercury was the ideal solution.
Fahrenheit was the first to use mercury as a thermometric liquid.
With mercury, he could make thermometers that could measure up to 600°F.
Further advantages of mercury are:
Low freezing point: -38°C
High boiling point: > 380°C
Same expansion coefficient at all temperatures
Doesn’t evaporate
The silver color is easy to see
We now know that mercury is also toxic and therefore it is forbidden to use it.
Around 1713 he stops using body temperature or ‘blood heat’ as a calibration point because he found that it was very unreliable.
That was when he discovered that the body temperature of youngsters was higher than that of elderly people.
Instead, he used the boiling point of water as the top calibration point of his scale. This would then correspond to 212°F.
He had a mercury thermometer calibrated at the freezing- and boiling point of water that he used as his standard thermometer to which he compared all other thermometers he made.
Fahrenheit, who never had higher education, did not quite understand the mathematics of his inventions but his perseverance and constant experimentation helped him to build accurate measuring instruments.
After traveling around for a number of years, he finally settled in Amsterdam in 1717 and made thermometers, barometers, and aerometers.
He eventually died penniless in 1736 after all the money, from the inheritance of his parents and the money he earned, was spent on experiments.
Convert Degrees Fahrenheit to
Newton
Rømer
Réaumur
Delisle
Celsius
Kelvin
Rankine
The Réaumur scale (1731)
René Antoine Ferchault de Réaumur (°1683 – †1757), born in La Rochelle (France), was a French entomologist and writer.
He studied philosophy, civil law, and mathematics and went to Paris in 1703 to continue his studies of mathematics and physics.
In 1708, at the age of 24, he was elected a member of the ‘Académie des Sciences’ which was an institution promoting French scientific research.
During his life, he wrote a lot of scientific papers dealing with many branches of science, ranging from geometry to the forms of birds’ nests and everything in between.
As an entomologist, he observed insects which led to a number of findings such as the possibility of spiders being used to produce silk, or the process of wasps making paper from wood fibers to build their nests.
Because precise temperature measurements are important in the field of physics and the thermometers that were used for this purpose were usually not very accurate, he developed his own thermometer in 1731.
Réaumur wanted to produce comparable thermometers that could be used for scientific research.
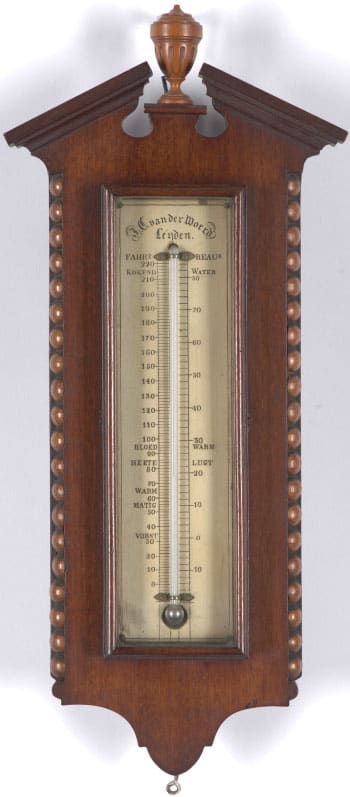
Collection Museum De Lakenhal, Leiden
He defined his thermometer with only one fixed point, the freezing point of water, which he marked with 0 degrees on his temperature scale.
As a thermometer liquid, he preferred alcohol (ethanol) diluted with water over mercury because it has a larger thermal expansion coefficient. Ethanol has a coefficient of 750 ppm/K, while it is 182 ppm/K for mercury.
In this way, there was a more noticeable difference on the scale, for the same change in temperature.
Réaumur carefully selected the composition of alcohol and water so that the thermometric liquid expanded 8% in volume when heated from the freezing point of water to the boiling point of water.
This means that 1000 parts at the freezing point of water gave 1080 parts at the boiling point.
This resulted in the definition of the boiling point at 80°Ré.
When applying a linear division between 0 and 80°, he ignored the non-linearity of the expansion of liquids and did not take into account the influence of atmospheric pressure, as a result of which Réaumur did not achieve his goal of producing comparable thermometers.
In addition, the thermometers were not suitable for measuring higher temperatures because alcohol has a low boiling point. This made them unsuitable for many applications.
However, his thermometers were used widely in Europe. Most of all in France, Germany, and Russia.
Around 1790, France introduced the metric system and therefore opted for the Celsius scale, but the Réaumur scale remained in use in some parts of Europe until the mid-19th century. In Russia even until the early 20th century.
In fact, even today in some parts of the food industry, the Réaumur scale is still used. For measuring the temperature of milk during cheese production in Switzerland and Italy for example, or for cooking sugar syrup for the production of meringue in some countries of Western Europe.
Convert Degrees Réaumur to
Newton
Rømer
Fahrenheit
Delisle
Celsius
Kelvin
Rankine
The Delisle scale (1732)
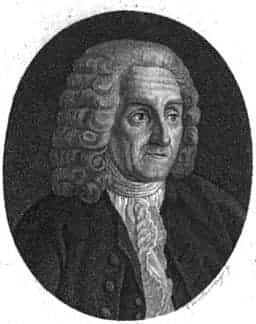
Joseph-Nicolas Delisle (°1688 – †1768) was a French astronomer and cartographer.
Born in Paris, he initially followed classical studies, but soon moved to astronomy. He entered the French Academy of Sciences in 1714.
In 1725, the Russian czar Peter the Great called him to Saint Petersburg to create and run the school of astronomy. He only arrived there in 1726. By that time the czar had already died.
In 1740 Delisle undertook an expedition to Siberia to observe the transit of Mercury across the sun. He set out from Saint Petersburg on 28 February 1740, arriving in Beryozovo (Siberia) on 9 April. A journey of 42 days.
But, he had no luck. All his efforts were in vain because on 22 April, the date of the transit of Mercury, the sun was obscured by clouds. Delisle was unable to make any astronomical observations.
Throughout the expedition, however, he made numerous other scientific observations about vegetation and wildlife in Siberia.
Despite all his efforts in the field of astronomy, he became best known for his invention of the Delisle temperature scale.
He made his first thermometers in 1724, using spirit of wine as a thermometric liquid. Unlike Réaumur, he did not dilute the spirit of wine with water.
The temperature of the Paris Observatory cellars was the only fixed point that he used to calibrate his thermometers.
It might seem a little odd to choose the temperature of a random cellar as a fixed point, but at that time a lot of scientists believed that the temperature of places underground was constant. In particular, they were persuaded that this temperature corresponded to an internal mean temperature at which the sun had brought the earth since its creation. This is of course not true, as we have found out later.
As from 1732 he changed his fixed point to the boiling point of water and marked it with 0°.
But with spirit of wine as a thermometric liquid, there was a serious problem, as spirit of wine boils at a lower temperature than water. Spirit of wine thermometers simply could not stand the heat of boiling water.
To solve this problem he had to change his thermometric liquid to mercury which has a boiling point way above the boiling point of water.
Originally the scale had 2400 divisions, appropriate to the winter in Saint Petersburg. Each division corresponded to one hundred thousandths of the contraction of the mercury in the thermometer, with higher values at lower temperatures.
This means that the Delisle scale was an inverted scale, on which increasing cold was indicated with higher numbers. This had the advantage that, in a large area of application, the numbers were never negative.
In 1738 the scale was slightly recalibrated by Josias Weitbrecht, a German professor of medicine and anatomy. He kept the 0° as the boiling point of water but assigned a value of 150° as the freezing point of water.
The Delisle scale was in use in Russia for almost 100 years during the eighteenth and nineteenth centuries.
Convert Degrees Delisle to
Newton
Rømer
Fahrenheit
Réaumur
Celsius
Kelvin
Rankine
The Celsius scale (1742)
Anders Celsius (1701-1744) was a Swedish astronomer and physicist who was born on November 27, 1701, in Uppsala, Sweden.
He was a professor at the University of Uppsala where he was teaching astronomy since 1730.
As an astronomer, he analyzed the changes in the Earth’s magnetic field and developed measuring tools to determine the brightness of stars.
In 1741 he founded the Observatory in Uppsala together with a few other people but he became best known for his invention of the Celsius scale in 1742.
Celsius created his temperature scale with only 2 defined points based on the physical characteristics of water.
The zero point (0°C) was defined at the boiling point of water and the second point (100°C) was defined at the freezing point of water, both referenced to the standard atmospheric pressure.
Yes, this is exactly the opposite of the Celsius scale as we know it today.
The reason why he chose an upside-down scale was that at that time the thermometer was mainly used to measure the outside temperature or body temperature, which both fell within a range between -20 and +40 modern degrees Celsius.
Choosing the 100°C at the freezing point of water avoided negative numbers when it was freezing outside.
For people today this could feel a little awkward having increasing numbers for decreasing temperatures, but in the end, it all comes down to a habit.
Several years after the Celsius scale was invented, some scientists began to use the inverted scale with 0°C defined at the freezing point of water and 100°C defined at the boiling point of water.
Especially biologists found it interesting to invert the scale. Since plants are at risk of dying at 0°C because the water is frozen, the scientists found it more obvious to indicate temperatures below the freezing point of water with negative numbers and temperatures above with positive numbers.
It is not really known who was the first person to invert the scale. Some say it was Carolus Linnaeus (Linné), a professor of medicine and head of the botanical garden at Uppsala University, others think it was Martin Strömer who succeeded the late professor A. Celsius on the chair of astronomy.
Because of the 100-degree interval, Celsius originally called it the Centigrade scale, centi being Latin for 100, but in 1948 the name was changed to Celsius scale which is the name that is still used today.
It was the ‘Conférence Général des Poids et Mesures’ that decided to change the name because ‘grade’ was already in use as a unit of measurement and could have been confused with ‘centigrade’.
Celsius didn’t get very old. He died from tuberculosis in 1744 at the age of 42.
Convert Degrees Celsius to
Newton
Rømer
Fahrenheit
Réaumur
Delisle
Kelvin
Rankine
The Kelvin scale (1848)
William Thomson, 1st Baron Kelvin (°1824 – †1907) and also called Lord Kelvin, was a Scots-Irish mathematical physicist and engineer.
He was born in Belfast (Northern Ireland) and worked at the University of Glasgow on the mathematical analysis of electricity and thermodynamics.
Together with a lot of other scientists, he played an important role in the formulation of the first and second laws of thermodynamics.
In 1866 he was knighted by Queen Victoria for his theoretical work on submarine telegraphy and his inventions for use on submarine cables used during the transatlantic telegraph project. He received the title of honor ‘Sir’ to put in front of his name: Sir William Thomson.
For his achievements in thermodynamics, and for his opposition to self-government for Ireland within the United Kingdom of Great Britain, he was ennobled in 1892, becoming Baron Kelvin of Largs (a town in Scotland). Kelvin is the name of a river that flows close to his laboratory at the University of Glasgow.
William Thompson became the first British scientist who joined the House of Lords in England. Therefore he is also called Lord Kelvin. Lord is a title in the UK formally given to a baron or a member of the House of Lords.
Kelvin, like many other scientists at that time, supported the idea of an absolute minimum temperature which they called ‘infinite cold’. According to classical physics, this would be the temperature at which all motion completely stops.
In other words, everything is frozen solid and there is no movement of atoms anymore.
In 1848, he published a paper, On an Absolute Thermometric Scale, that stated that this absolute minimum temperature was -273°C. Now, this value has been corrected to -273,15°C.
This means that negative temperatures on the Kelvin scale are impossible as nothing can be colder than the absolute zero temperature.
The divisions on the Kelvin scale are of exactly the same size as those of the Celsius scale, but the Kelvin unit is not expressed in degrees and thus the symbol ° is not present.
While relative temperature scales, e.g. Fahrenheit or Celsius, are comparing the temperature of an object to a randomly chosen fixed point (like the freezing point of water), absolute temperature scales work differently. They indicate temperatures compared to absolute zero.
In this way, absolute temperature scales are not only indicating the temperature of an object but also provide information about the amount of kinetic energy of its atoms and molecules. The kinetic energy is zero at a temperature of zero Kelvin and has a higher value at higher temperatures.
In 1954, the General Conference on Weight and Measures (CGPM) adopted the Kelvin as the base unit for thermodynamic temperature and formulated a definition for the unit:
The Kelvin, unit of thermodynamic temperature, is the fraction 1/273,16 of the thermodynamic temperature of the triple point of water.
As the triple point of water (273,16 K) is a very precise and reproducible temperature, it has been chosen as a fixed point on the Kelvin scale.
The water used for calibration of temperature measurements is not just any water. It has been standardized by the International Atomic Energy Agency (based in Vienna) in 1968 and is referred to as Vienna Standard Mean Ocean Water (VSMOW). The designation ‘ocean water’ refers only to the evaporation of ocean waters in the water cycle as the original source of fresh surface and ground waters.
Besides the triple point of water, another 16 defining points have been selected by an international agreement, ranging from the freezing point of helium to the freezing point of copper.
Unless you are a scientist or an engineer, you will make little use of the Kelvin scale since it is used almost exclusively for scientific purposes.
Convert Kelvin to
Newton
Rømer
Fahrenheit
Réaumur
Delisle
Celsius
Rankine
The Rankine scale (1859)
William John Macquorn Rankine (°1820 – †1872) was a Scottish professor of Civil Engineering and Mechanics with a great interest in railway engineering, molecular physics, and thermodynamics.
He was born in Edinburgh (Scotland) but moved to Glasgow in 1851 to work at the University of Glasgow where he taught the theory and practice of civil and mechanical engineering.
Rankine was especially interested in thermodynamics and developed a complete theory of the steam engine and in fact of all heat engines.
He had also plenty of other interests in other branches of science, mathematics, and engineering.
In 1859 he developed his temperature scale. It was a thermodynamic scale just like the one Kelvin had developed, but the Rankine scale was based on degrees Fahrenheit instead of degrees Celsius, as was the case for Kelvin.
The Rankine temperature scale starts at absolute zero and every division has the same size of a degree Fahrenheit. Thus a temperature of 0 R is equal to 0 K, or -459,67 °F.
The triple point of water, which is at 491,688 R, is used as a fixed point on the scale. The water used here is also according to the Vienna Standard Mean Ocean Water (VSMOW) standard.
Most people write the Rankine unit as °R, but the US National Institute of Standards and Technology (NIST) is recommending against the use of the degree symbol to emphasize the similarity with Kelvin.
The Rankine temperature scale is only applied for scientific applications when formulas are expressed in Imperial Units. It can be used for calculations like radiation heat transfer, entropy change, the Carnot Heat Engine thermal efficiency, or the Ideal Gas Law.
The Rankine scale has been largely replaced by the Kelvin scale. Nowadays, I imagine it is hard to find any scientific work making use of the Rankine unit. But, if you want to dive into old scientific papers, knowledge of this temperature scale can come in handy.
Rankine, unmarried and without children, died on Christmas Eve in 1872 at the age of 52.
Convert Rankine to
Newton
Rømer
Fahrenheit
Réaumur
Delisle
Celsius
Kelvin
Why do we have different temperature scales?
As I promised you at the start of this article, let me explain to you why we have different temperature scales.
Back in history, in the 18th and 19th centuries, there was a big discussion among scientists about the best way to measure temperature.
First of all, which thermometric liquid should be used? Secondly, how to graduate the scale? And thirdly, how to calibrate it?
A lot of experiments were going on and some scientists, often astronomers who had to compensate their measurements for variations in temperature, started to make their own thermometers.
Some of them did a good job and succeeded in creating a reliable thermometer. Others did not succeed and their thermometers quickly went into oblivion.
So, there was and still is historical evolution in using temperature scales. We didn’t create just one scale, we created many different scales.
Some of these scales were widely used in Europe and Russia.
Changing from one scale to another takes time, time to convince people to use the other scale. As you know, people always resist change.
Temperature scales, like those created by Newton, Rømer, Réaumur, or Delisle, all disappeared and were replaced by the Celsius scale when a lot of countries started to introduce the metric system around 1790.
A few countries maintained the imperial or the customary system and continued to measure temperature in degrees Fahrenheit. Today, these countries are the United States, Liberia, and Myanmar. Some other countries use both Fahrenheit and Celsius.
The Kelvin and Rankine scales are only used for scientific reasons, whereby Kelvin is by far the most used scale, and Rankine is only used in a few specific fields of engineering, like thermal power plants.
So, this leaves us with only 3 different scales which are Fahrenheit, Celsius, and Kelvin. Knowing that the Fahrenheit scale is in decay, there may be only two scales in the future.
Eventually, perhaps only Kelvin will remain, though it still sounds a bit weird to indicate outside temperature with 3 digits.
This datasheet template can specify level transmitters based on a differential pressure measurement using a resistive, piezo-resistive, piezo-electric, capacitive, or silicon resonant sensor.
Click once on the download button to download the datasheet in Excel format. If you prefer to first have a look at it in PDF, click the template image below. Further instructions for downloading and using this template are at the bottom of this page.
Notice Instrupaedia has no link whatsoever with an existing manufacturer or supplier of this type of device, nor do we receive any commission on the use of this datasheet template. The only objective is to help you specify and order your material. You can fill in the datasheet template and send it to any supplier of pressure gauges you want.
The Excel file will be sent to your device after pressing the download button. If you do this from a computer or an Android phone, the file will end up in your download folder. From there you can open it by double-clicking on the file. Of course, you must have Microsoft Excel 2007 or later installed.
To perform a download to an iPhone or an iPad, tap on the download button of the desired datasheet. Then tap on the Share button and select the location where you want to save the file. This could be your Download folder, Dropbox or iCloud service. Now, tap the Save button and you’re done. To open the datasheet, you must first install a spreadsheet program on your device. In the app store, you can find programs like Numbers (Apple) or Microsoft Excel (Microsoft). Please note that these apps are not free. After the download, you can then open the file with your spreadsheet app.
The full functionality will not be available on a smartphone or a tablet. To be able to use all of the features of this datasheet, it is best to open it with Microsoft Excel 2007 or later via a laptop or desktop computer.
Instructions for using the template
Layout of the datasheet template
The template is divided into several blocks, with each block containing related information. For example, there is a block with information about the process conditions, another about the sensor element, or yet another about the enclosure …
Each block contains cells on the left with a description of a property on which a choice must be entered in the cells on the right.
Drop-down lists
For many of these cells, a choice can be made from a drop-down list. To do this, first click in the cell and then on the small triangle to the right of the cell. Make a choice from the list and select this choice by clicking on it. Your choice will be automatically entered in the selected cell. With the help of the drop-down lists, you can easily find the right technical term for the desired property.
Some cells do not have a drop-down list because the information that must be entered has endless possibilities. These cells have to be entered directly.
Error messages
The suggested choices from the drop-down lists correspond to what is available from most suppliers. If you think you need something else, you can enter the cell directly without making a choice from the list. However, some cells cannot be entered directly. This is to prevent you from entering something wrong. If you do it anyway, you will receive an error message with explanatory text. There are error messages that you can override and others that oblige you to make a choice from the drop-down list.
Comment blocks
Cells with a red triangle in the upper right corner open up a comment block when you hover over it. The comment relates to what you can enter in the cell or provides an explanation of the possible choices, so you will fully understand the impact of your choice.
Input messages
Every cell that has a drop-down list or a comment block also shows an input message when the cell is clicked. The input message appears in a rectangle below the cell and indicates whether you are obliged to choose from the list or whether you can enter something else. Sometimes the message also gives an extra tip.
Company logo
If you like you can put your own company name or logo in the bottom-left cell of the title block.
Although you can remove the Instrupaedia logo, please be so kind to leave it in so other people who receive this datasheet could also find it on the web and use it to their benefit too.
“Suggestions to improve this datasheet are always welcome.”
“If you think something needs to be changed, deleted or added, please leave a comment in the comments section below.”
Advertisement
Potentiometric pressure transducer
A small pressure sensor with a lot of applications
The use of pressure measurements dates back to the mid-19th century when the first mechanical pressure measurements were invented. The working principle was based on a balanced spring or a Bourdon tube, and the indication was represented by a pointer on a dial.
Only 80 years later, the first electric pressure transducers were invented. It started with a Bourdon tube attached to a potentiometer, creating the first potentiometric pressure transducer. A few years later followed by the unbonded and bonded strain gauges. The change in electrical resistance that is due to pressure changes, was always the basic principle. It took 30 more years before the principle of piezoresistivity was applied to pressure measurements.
Resistive transducers are widely used in the industry today because of their many advantages such as reliability, simple construction, mature design and production process, adjustable resolution, and maintenance-free properties.
Potentiometric transducer working principle
The principle of the potentiometric pressure measurement is based on the change in resistance of a potentiometer. The wiper of the potentiometer is mechanically connected to a pressure-sensitive element, such as a Bourdon tube, a bellows, a capsule, or a diaphragm. The deflection of the pressure-sensitive element determines the position of the wiper on the potentiometer. As a result, the resistance value changes between the wiper and one end of the potentiometer. This resistance value is a measure of the pressure applied to the sensing element.
Potentiometric pressure transducer animation
Potentiometric sensor design
A potentiometer mainly consists of a resistance element having a connection terminal at each end, a sliding track that is connected to the third terminal, a wiper, and the housing.
The motion of the sensor is amplified through a mechanical transmission that moves the wiper over the full range of the potentiometer. By means of one or more sliding contacts, the wiper makes contact with the resistance path. Through a second (set) sliding contact(s), the tapped voltage is passed to the sliding track and made available at the output terminal of the potentiometer.
Due to friction between the sliding contacts and the resistance path, wear will occur on the potentiometer, which will change its resistance value and increase the noise. The wiper and the sliding contacts are usually made of a precious metal alloy (eg, a platinum alloy) to have a longer life and less noise.
The wiper has multiple sliding contacts to ensure that the potentiometer has a better resolution.
Depending on the application, the resistance element may be composed of resistance wire, a layer of carbon composite, a metal film or cermet (a mixture of ceramics and metal), or a conductive plastic. Today, most potentiometers use cermet or conductive plastic because these materials are abrasion resistant and their resistance value remains stable for a long time.
The housing protects the potentiometer against dust and moisture. A pressure-resistant housing can be provided for use in potentially explosive atmospheres.
Both wirewound and precision potentiometers with infinite resolution can be used. The composition and properties of the various types of potentiometers are described below.
At resistorguide.com you can find more detailed information about the operation and properties of the different types of potentiometers. Please note that not all potentiometers shown there can be used for potentiometric pressure transducers.
Rotary potentiometer
single turn rotary potentiometer Photo by lainf / CC BY-SA 3.0
There are two design variations for a rotary potentiometer: single-turn and multi-turn. The most widely used industrial potentiometers are single-turn rotary potentiometers.
To move along the entire resistance range, single-turn potentiometers need to rotate less than 360°, while multi-turn potentiometers need to make multiple revolutions (e.g. 5, 10, 20, or 25 turns).
Due to their longer resistance path, multi-turn potentiometers have a higher resolution than single-turn potentiometers and are therefore much more accurate. The more complex design, however, also ensures that multi-turn potentiometers are more expensive.
Linear potentiometer
linear potentiometer Photo by Omegatron / CC BY-SA 3.0
Unlike the rotary potentiometer, where the wiper performs a circular motion, the wiper of a linear potentiometer slides over a rectangular strip of resistance material in a straight line.
Because this potentiometer requires a large longitudinal opening for passage of the slider, there is a greater risk of dust and moisture getting caught between the sliding contacts and the resistance element. This causes more noise and even an interruption of the output signal.
Brushes or overlapping plastic foils covering that large opening can prevent dust from getting into the potentiometer but the risk is never excluded.
Wirewound potentiometer
A wirewound potentiometer is made by wrapping a resistance wire, usually nickel chrome, around a ceramic, plastic, or glass fiber core. Both ends of the resistance wire are attached to the terminals.
Usually, nickel-chromium is used as the resistance wire because this material has a very low temperature coefficient of resistance, which leads to a more stable potentiometer. The coil is usually enclosed by a ceramic layer that only leaves the wiper’s path uncovered so that it can make contact with the resistance element.
wirewound potentiometer
The wiper moves over the resistance element, sliding from one turn of wire to the next. Each time the wiper makes or breaks contact with a turn of wire, it causes an additional electrical signal called “noise”. The noise increases as the resistive element wears out.
Since the wiper does not follow the resistance wire but slides from one turn of wire to the next, the potentiometer resolution will also not be infinite. The tapped resistance value is each time incremented by the resistance of one turn of wire. The resolution is therefore determined by the resistance of one turn of wire and can be calculated as the reciprocal of the number of turns (1/n).
Due to the fact that the resistance wires are wrapped around a core, they also form a coil which creates an unwanted inductance. This results in poor frequency response when using frequencies from about 50 kHz.
Advantages
Long lifespan
Highly accurate
High power
Low temperature coefficient
Better stability
Disadvantages
Poor frequency response
Low resolution
More noise
Carbon film potentiometer
carbon film potentiometer
A carbon film potentiometer consists of a thin layer of carbon composite ink, molded on a phenolic resin base. The production process is quick and easy and therefore these potentiometers are quite cheap.
In their favor: good frequency response and an acceptable level of noise and wear. The noise is getting bigger at rising temperatures. A disadvantage is the lesser accuracy of these potentiometers.
Advantages
Low cost
Acceptable noise and wear
Good frequency response
High level of heat dissipation
Disadvantages
Less accurate (+/- 10%)
More noise at higher temperatures
Poor moisture resistance
Cermet potentiometer
Cermet (CERamicMETal) potentiometers have a resistance element that consists of a mixture of metal particles and ceramics. Usually, the mixture contains less than 20% metal. The most commonly used metals are nickel, molybdenum, and cobalt.
Cermet resistive elements contain ceramic-based ink, which allows a higher level of heat absorption and dissipation than most other composite materials used in potentiometers. They also have a wider temperature range compared to other composites, partly because they have a low temperature coefficient. A typical temperature coefficient for a Cermet potentiometer is 150 ppm/°C (0.015%). This is a lot lower than with plastic film or carbon film.
Advantages
Good frequency response
Tight tolerance
Long-term stability
Low temperature coefficient
Good noise characteristics
Good linearity
Resistant to high temperatures
Disadvantages
Quite expensive
Limited lifespan
Low surge current
Plastic film potentiometer
The plastic film is sometimes also referred to as conductive plastic. The resistance element is composed of a plastic resin such as epoxy, polyesters, improved phenolics, or polyamides to which carbon powder is added. The carbon grain size of about 0.01 μm determines the potentiometer resolution. The mixture is applied in a thick layer to a ceramic or plastic substrate using screen-printing methods and is then hardened in an oven.
The temperature coefficient of conductive plastic can vary widely depending on the production process used. Sometimes metal powders such as nickel, silver, or copper are added to the mixture to improve the temperature coefficient. The material selection of the substrate also influences the temperature coefficient. A plastic substrate provides better results because of better compatibility with the plastic film resistance element.
Advantages
High resolution
Long lifespan
Low noise
High stability
Very good linearity
Suitable for high frequencies
Disadvantages
Expensive
Moderate temperature coefficient
Low power capability
The potentiometer as a voltage divider
In principle, a potentiometer is nothing more than a voltage divider. The wiper divides the resistance element into two variable resistors whose resistance value depends on the position of the wiper. The voltage Vs connected to the resistance element is divided between the two variable resistors R1 and R2.
The voltage across the load RL can then be calculated as follows:
If we assume that RL is very large, relative to R1 and R2, we can divide the numerator and denominator by RL. We then get the following simplified formula:
Pros and cons of potentiometric transducers
One of the biggest benefits is the simplicity of the technology. A problem with a potentiometer can often be solved with an ordinary multimeter.
They can also be easily adapted to the application because they can be manufactured very small and can, therefore, be installed in very small spaces.
Due to the high output signal level, there is no need for signal enhancement and no need for conditioning of the signal. Therefore, they can be used for low power applications, because 0.1 mA from the transmitter is sufficient to read the resistance value. In addition, they are quite cheap because the resistance value can easily be converted to a standard voltage or current signal.
Their disadvantages include the large hysteresis that results from the wiper’s sliding friction over the resistance element, the vibration sensitivity which can be largely solved by the use of multi-finger wipers, and their short life which is mainly due to the friction of the wiper on the resistance element.
*in case of wirewound potentiometers
**especially with wirewound potentiometers
Advantages
Simple technology
Easily customizable to application
High output signal
Cheap
Disadvantages
Large hysteresis
Sensitive to vibration
Short lifespan
Poor repeatability
Low accuracy
Limited resolution *
Poor frequency response
Noise **
Selection criteria for potentiometric transducers
Making a good choice for a potentiometric transducer is not an easy task. Technicians in charge of this task will benefit from a good knowledge of existing technologies and the process parameters of the application. Besides the cost of the device, the following technical aspects are best considered:
The expected accuracy and linearity
The required range
The repeatability
The resolution
The required torque/force to move the wiper
Environmental factors like vibration, dust, temperature, humidity
The expected life span
The stroke/deflection of the sensor
The speed of movement
Applications with potentiometric transducers
Potentiometric pressure transducers can be used to measure absolute, relative, or differential pressure depending on how the pressure sensor is built.
They are used for industrial and military purposes as oil pressure gauges for display on the dashboard, flow measurement of air supply to combustion engines, or pressure measurements for ground support equipment at airports.
In addition to pressure measurement applications, the potentiometric transducer is also used for many other applications such as positioning, displacement, level, flow rate measurement, etc.
Actuators use potentiometers for simple position feedback or as an input signal for position control of the actuator. Quarter-turn actuators only use a gear transmission to rotate the potentiometer over a full turn. Linear actuators can either use a linear motion potentiometer if their stroke is not too large or a rotational potentiometer if the transmission is done by means of a lever.
Other applications for potentiometric transducers:
Suspension travel
Wing deflection
Medical equipment
Steering position
Scissor lift
Cut-off saw
Position of the fork in forklift trucks
Brake position
Clutch position
Throttle position
Datasheet template
An easy configurable Excel template is available for specifying pressure transmitters. This datasheet is designed to define pressure transmitters for all kinds of applications.
Datasheet templates for other types of instruments can be found in the datasheet library.
References
Regtien Paul P.L. 2012. Sensors for Mechatronics. Elsevier. 322pp
Lipták Béla G. 2003. Instrument Engineers’ Handbook, Vol. 1: Process Measurement and Analysis, 4th Edition. CRC Press. 1867pp
Du Winncy Y. 2015. Resistive, Capacitive, Inductive and Magnetic Sensor Technologies. CRC Press. 408pp
Du Winncy Y. and Yelich Scott W. 2012. Resistive and Capacitive Based Sensing Technologies. In: Yurish Sergey Y. (ed). Modern Sensors, Transducers and Sensor Networks. International Frequency Sensor Association Publishing. 422pp
Todd C.D., Hardison W.T. and Galvan W.E. (eds). 1975-2008. The Potentiometer Handbook, Users’ Guide to Cost-effective Applications. McGraw-Hill Book Company. 227pp
Pressure transmitter working principles: a brief overview
The purpose of a pressure measurement
The use of pressure measurements in the industry is becoming more and more widely spread. Pressure is the second most measured process variable after temperature. Millions of pressure measurements are produced every year to satisfy the needs of the customer.
But what is the purpose of all these measurements?
Well, pressure measurements are used primarily for three reasons:
Indication of pressure at a distance
Pressure control in control loops
Monitoring of pressure thresholds in automated processes
Composition of a pressure transmitter
A pressure transmitter consists mainly of the pressure sensor, the secondary electronics, and the enclosure. Each of these components has a specific function.
The pressure sensor converts the measured pressure into a measurable electrical signal.
The secondary electronics is the electronic part of the transmitter that is reading the sensor signal, conditions that signal (linearization, compensation of the temperature effect, amplification …), and finally transforms it into an industry-standard output signal, for example, 4 – 20 mA.
The enclosure eventually holds all the parts together, includes the components for connecting the signal cable, provides the necessary protection against water and dust, and occasionally provides protection against explosion (Ex d version) when used in hazardous areas.
Composition of a pressure transmitter
What is a transducer?
A transducer is a device that converts a signal from one physical form to a corresponding signal having a different physical form. There are six different types of signals – mechanical, thermal, magnetic, electrical, chemical, and radiation. A transducer is converting one of these six types of signals to one of the other five types of signals.
If we take the example of a pressure transducer, it will convert the mechanical pressure signal, such as the deflection of a diaphragm, to an electrical voltage signal.
What is the difference between a transducer and a transmitter?
The biggest difference between these 2 is that a transmitter has secondary electronics for conditioning and amplifying the signal. A transducer is, in fact, a part of a transmitter. If a pressure sensor has an output signal in the magnitude of millivolts, it is called a transducer. If this output signal is amplified and converted into a milliamp signal, then it is called a transmitter. The transmitter converts the transducer’s millivolt signal into an industry-standard signal such as a 4-20mA or a 0-20mA.
There is a lot of confusion about the use of these terms in the industry. A transmitter is often referred to as a transducer and vice versa, or a sensor is considered a transducer.
How to measure pressure?
If you look at industrial pressure sensors, you will see that almost every sensor is using a diaphragm to measure the pressure. The impact of the pressure is deflecting the diaphragm and in one way or another, this deflection leads to a change in resistance, capacitance, reluctance, or generated voltage. Below is a brief description of the various working principles of a pressure transmitter.
Resistive pressure measurement
Resistive pressure measurements can be subdivided into potentiometric, strain gauges and piezoresistive pressure measurements, depending on whether you use a potentiometer, metal or semiconductor strain gauges. In each of these cases, the idea is that the measured pressure causes a resistance change within the sensor. This can be done by turning a potentiometer or expanding and contracting metal or semiconductor strain gauges. The resistance change is a measure of the measured pressure. Read more about potentiometric pressure sensors.
Piezoelectric pressure measurement
The piezoelectric pressure measurement uses a monocrystalline quartz crystal. When pressure is exerted on this crystal in a certain direction, a positive and a negative charge results on opposing surfaces of the crystal. This charge causes an electrical voltage across the crystal proportional to the measured pressure. This voltage generates an electrical current that can be amplified and converted to an output signal of the transducer.
The piezoelectric pressure measurement is only suitable for measuring dynamic to quasi-static pressures. Truly static pressures cannot be measured because of charge leakage causing rapid decay of the crystal’s electrical signal.
Capacitive pressure measurement
The principle of the capacitive pressure measurement is based on the change in capacitance between a metal diaphragm and a solid metal plate. When the diaphragm bends under the influence of the process pressure, the distance between the 2 plates decreases, which increases the capacitance of the capacitor. Secondary electronics measure this capacitance and convert it into a proportional pressure signal. Capacitive pressure measurements have a high sensitivity, allowing very low pressures to be measured.
Resonant wire pressure measurement
An oscillator circuit driven by a magnetic field causes a wire to oscillate at its resonant frequency. One side of the wire is firmly fixed to a static part while the other side is attached to the diaphragm. A spring causes the wire to be pretensioned. Due to the effect of the process pressure on the diaphragm, the wire will stretch at increased pressure and shrink at reduced pressure. The resonance frequency will increase or decrease accordingly. A digital counter measures the change in resonance frequency and passes its signal to a microchip that also compensates for linearization and temperature compensation.
Inductive pressure measurement
The principle of inductive pressure measurement is based on the change in impedance of a coil due to the displacement of a ferromagnetic core which is firmly connected to the pressure sensing element. A Bourdon tube as well as a diaphragm, bellows or a capsule can be used as pressure sensing element. The effect of the pressure on the pressure sensing element causes the displacement of the ferromagnetic core. The change in impedance of the coil resulting from this is proportional to the measured pressure.
Examples of this measurement principle are the LVDT (Linear Variable Differential Transformer) transducer and the variable reluctance transducer.
Optical pressure measurement
Optical sensors use glass fibers through which a light beam is sent. This beam of light is characterized by parameters such as intensity, frequency, phase and polarization. When the glass fiber is exposed to the process pressure, one or more of these parameters will change. The change of these parameters is a measure of the measured pressure. There are several types of sensors designed to measure either one or the other parameter.
Hall effect pressure measurement
The Hall effect sensor consists of a thin plate of conductive material through which a constant electrical current is passed. The connections for the output signal on the plate are perpendicular to the direction of current flow. When the Hall effect sensor is placed in a magnetic field perpendicular to the plate and to the direction of the current, an electric potential difference occurs at the output terminals. For pressure measurement applications, the magnetic field is generated by a permanent magnet which is fixedly connected to a pressure sensing element. At increasing process pressure, the magnet will move towards the Hall effect sensor. This results in a stronger magnetic field in the Hall effect sensor and its output voltage will increase proportionally to the process pressure.
Recent developments
Since the beginning of the new millennium, there have been many new developments for pressure transmitters in industrial applications. The progress of electronics and particularly its miniaturization has made that a lot of problems were solved.
New technologies have resulted in lower power consumption, faster response, and reduced dimensions and weight. This could seem of less importance at first sight but is of great importance for certain industrial applications. Due to the low-power consumption of pressure sensors and transducers, pressure measurements can be performed in shorter intervals of about 0,5s. This will then also lead to a faster response time in dynamic pressure applications.
Smaller dimensions and weight can be important for applications in narrow spaces, like under the hood of your car for measuring the content of the fuel tank in natural gas vehicles.
In addition to these improvements, progress has also been made in terms of accuracy, repeatability, and reliability.
Today’s most common pressure measurement principles include strain gauges, piezoresistive, piezoelectric, and variable capacitance.
Each of these techniques and a few others will be explained in the next articles.
References
Béla G. Lipták – Instrument Engineers’ Handbook, Vol. 1 Process Measurement and Analysis, 4th Edition-CRC Press (2003)
ABB – Pressure Measurement Theory and Application Guide (2012)